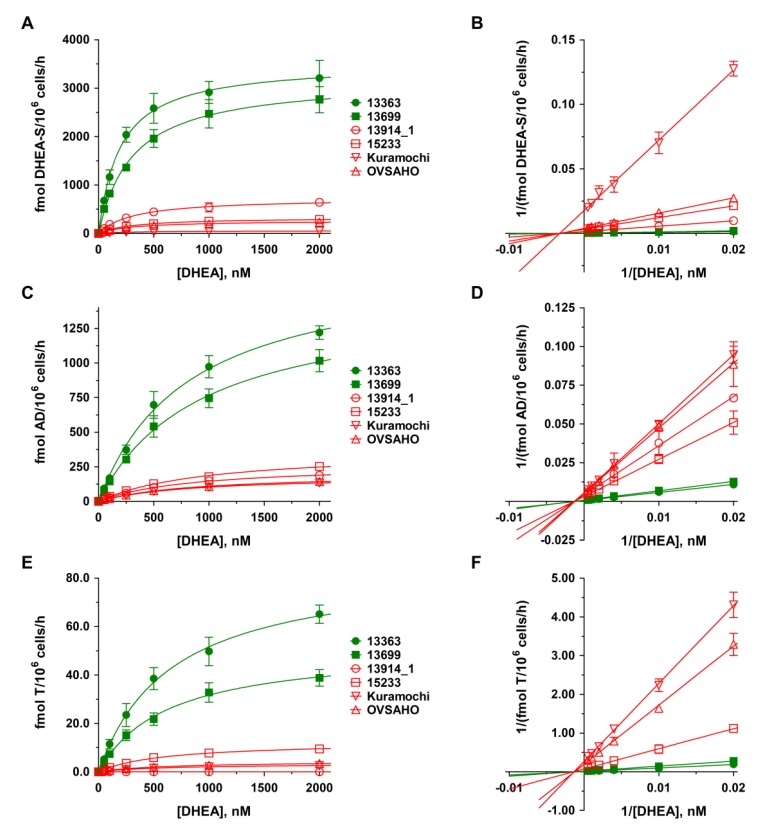
Figure 2.
Kinetic profiles of dehydroepiandrosterone (DHEA) metabolite formation in platinum-sensitive and -resistant HGSOC cells. The kinetics of (A–B) DHEA sulfation, (C–D) AD formation, and (E–F) T formation were calculated following the incubation of all HGSOC cell lines with 0 to 2000 nM DHEA as a hormone precursor for 48 h. Data are displayed as Michaelis–Menten and Lineweaver–Burk plots and represent the means ± SD of three independent experiments. Green curves indicate sensitivity and red curves indicate resistance against carboplatin to the investigated HGSOC cell lines. Differences were statistically significant between these two groups (p < 0.05).

