Figure 5.
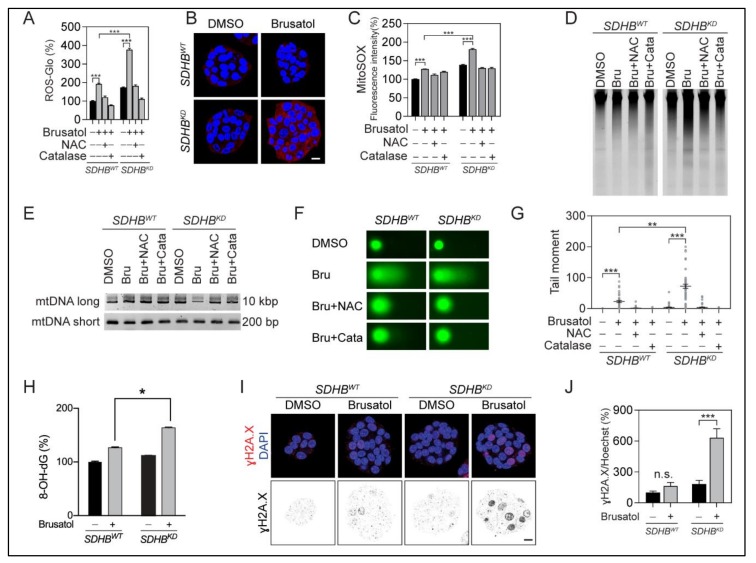
Brusatol disrupted ROS homeostasis and led to oxidative DNA damage. (A) ROS quantification assay showed that brusatol increased ROS level, especially in SDHBKD MPC cells. Exogenous ROS scavengers restored ROS to the normal level. ROS signal was measured and normalized to protein quantification. *** p < 0.001. (B) MitoSOX-Red staining showed increased ROS level in SDHBKD MPC cells after brusatol treatment. Bar = 10 μm. (C) Flowcytometry analysis showed increased MitoSOX-Red signal in SDHBKD cells after brusatol treatment. ROS scavengers restored ROS to normal level. Dimethyl sulfoxide (DMSO) was used as solvent control. Cell nuclei were labeled with 4′,6-diamidino-2-phenylindole (DAPI). Bar = 10 μm. (D) Total genomic DNA electrophoresis showed increased DNA fragmentation in SDHBKD MPC cells with brusatol treatment. (E) Mitochondrial deoxyribonucleic acid (mtDNA) PCR assay showed the long and short fragments from the mitochondrial genome of MPC cells was performed after brusatol treatment. Exogenous ROS scavengers restored DNA fragmentation. (F) Comet assay showed increased DNA fragmentation (Comet tail) in SDHBKD MPC cells. Exogenous ROS scavengers restored DNA fragmentation. (G) Quantification of comet assay in Figure 5F. ** p < 0.01; *** p < 0.001. (H) Oxidative DNA damage ELISA assay showed stronger elevation of 8-OH-dG in SDHBKD MPC cells with brusatol treatment. * p < 0.05. (I) Immunostaining showed elevated γH2A.X in SDHBKD MPC cells with brusatol treatment. Bar = 10 μm. (J) Quantification of γH2A.X in Figure 5I. *** p < 0.001.

