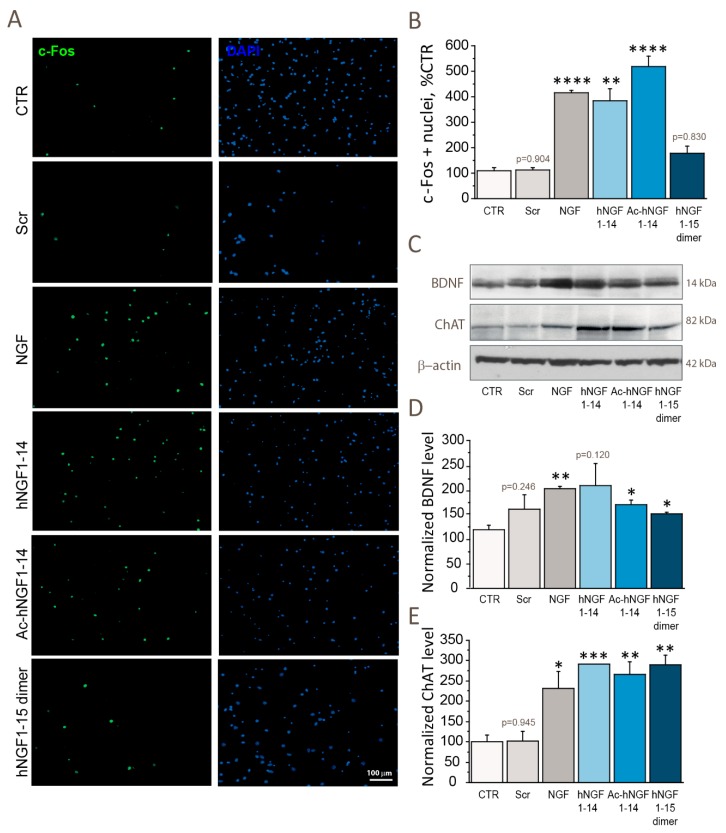
Figure 3.
hNGF1–14 peptides mimic NGF by inducing neuronal activity, BDNF and ChAT levels. (A,B) Quantitative analysis of the ratio of c-Fos expressing nuclei in cholinergic neurons incubated for 60′ with 10 μM scrambled hNGF1–14 (Scr), 10 μM hNGF1–14, 10 μM Ac-hNGF1–14, 10 μM hNGF1–15 dimer and 100 ng/mL (3.84 nM) NGF. Neurons were immunolabelled for c-Fos and nuclei were counterstained with 4′,6-diamidino-2-phenylindole (DAPI). The number of c-Fos positive nuclei was calculated as ration over the total number of nuclei per field, and reported as percentage of CTR. (C, E) Representative western blotting (C) against BDNF and ChAT in cholinergic neurons incubated for 60′ with 10 μM scrambled hNGF1–14 (Scr), 10 μM hNGF1–14, 10 μM Ac-hNGF1–14, 10μM hNGF1–15 dimer and 100 ng/mL (3.84 nM) NGF. (D,E) Densitometric analysis of BDNF (D) and ChAT (E) level in cholinergic neurons treated for 60′ with 10 μM scrambled hNGF1–14 (Scr), 10 μM hNGF1–14, 10 μM Ac-hNGF1–14, 10 μM hNGF1–15 dimer and 100 ng/mL (3.84 nM) NGF. The c-Fos (n = 4), BDNF (n = 3) and ChAT (n = 3) data were expressed as percentage of CTR and reported as mean ± SEM. The β-actin was used as loading control. * p < 0.05; ** p < 0.01; *** p < 0.001; **** p < 0.0001. Full-length blots are presented in the Supplementary Material. Scale bar = 100 μm.

