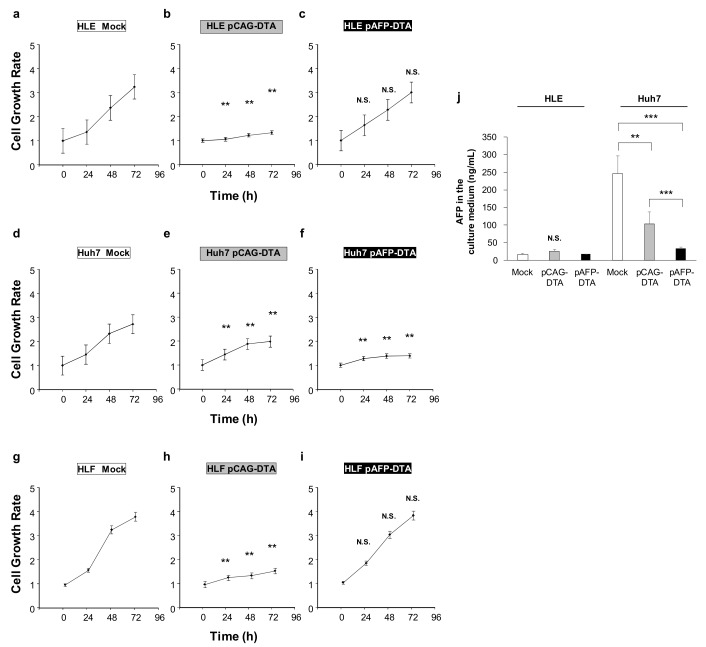
Figure 3.
Effect of DTA on hepatocellular carcinoma (HCC) cell growth. The cell growth of HCC cell lines and permanent clones overexpressing DTA determined by MTT assay. (a–c) Cell growth of HLE and (d–f) Huh7, and (g–i) HLF cell lines transfected with mock or CAG–DTA or pAFP–DTA. The values represent mean ± standard deviation (five samples from each group of three, where n = 15 for each group at different time points). ** p < 0.01 and no statistical significance (N.S.). Two-way ANOVA followed by Bonferroni’s multiple comparison test. (j) A concentration of AFP in the cell culture medium at 72 h after transfection was quantified by ELISA. The values represent mean ± standard deviation (n = 3 for each group). ** p < 0.01, *** p < 0.001, and N.S. One-way ANOVA followed by Bonferroni’s multiple comparison test.

