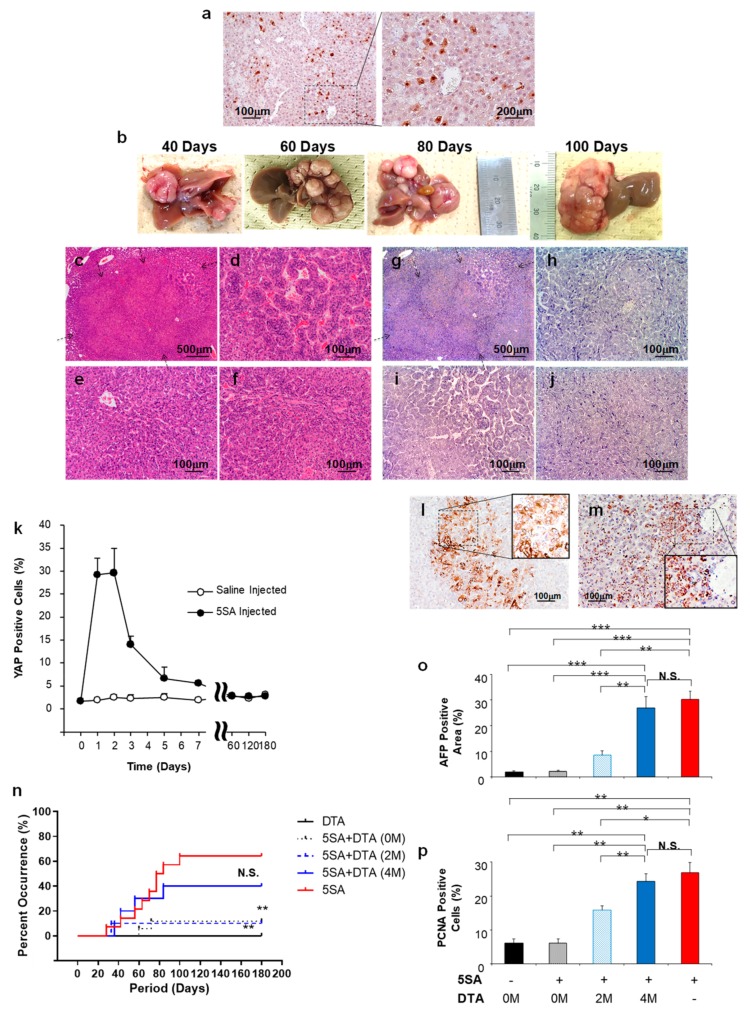
Figure 4.
Effect of DTA on HCC mice model. (a) Expression of yes-associated protein (YAP) in the liver 3 days after the hydrodynamic gene delivery of YAP-expressing plasmid (5SA). (b) Representative images of time-dependent liver–tumor occurrence and sizes. (c–f) Hematoxylin and eosin staining and (g–j) immunohistochemical staining of YAP of the liver tumor. (k) Time dependent changes in YAP expression in the liver after 5SA injection. Quantification was performed by measuring the integrated density in pixels using the ImageJ software (version 1.6.0_20, National Institutes of Health, Bethesda, MD, USA). The values represent mean ± standard deviation (n = 5 for each group). (l,m) Immunohistochemical staining of the AFP of the liver–tumor developed 40 (l) and 100 days (m) after the delivery of 5SA. (n) Cumulative HCC occurrence curve in the liver of 5SA-injected mice generated by the Kaplan–Meier method. The occurrence rate of HCC was compared with 5SA injected with no treatment (5SA, red solid line), treated with pAFP–DTA immediately after treatment (5SA + DTA (0 M), black dot line), 2 months after treatment (5SA + DTA (2 M), blue dot line), 4 months after treatment (5SA + DTA (4 M), blue solid line), and control (pAFP–DTA with no ¬YAP induction, DTA, black solid line). n = 15 for each group. ** p < 0.01 and N.S. compared with the 5SA-delivered mice with no treatment group (red solid line). Log-rank test. Quantitative analysis of area with positive staining for AFP (o) and proliferating cell nuclear antigen (PCNA) (p) in the tumors of each group developed 180 days after YAP-expressing plasmid (5SA) delivery with/without gene therapy of pAFP–DTA. Quantification was performed measuring the integrated density in pixels using the ImageJ software (version 1.6.0_20, National Institutes of Health). The values represent mean ± standard deviation (n = 5 for each group; same number of liver tissue specimens were assessed for no 5SA-delivered group). * p < 0.05; ** p < 0.01; *** p < 0.001; and N.S. One-way ANOVA followed by Bonferroni’s multiple comparison test. 0 M, 2 M, and 4 M, at 0, 2, and 4 months after the delivery of pAFP–DTA.

