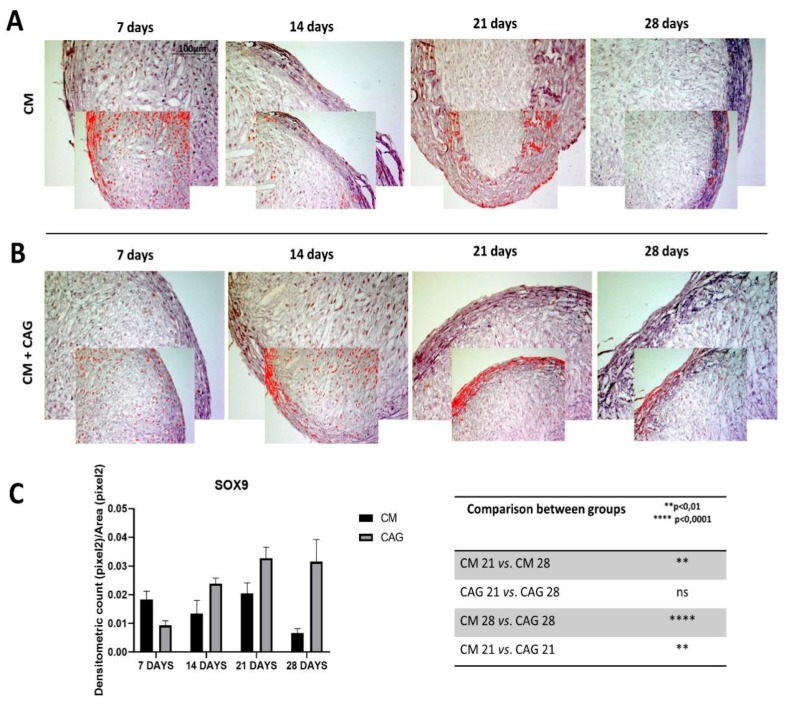
Figure 4.
SOX9 immunohistochemical evaluation in 3D AMSC-derived chondropellets at 7, 14, 21, and 28 days of culture through computerized densitometric measurements and image analysis. (A) control group (chondrogenic medium: CM); (B) CAG-supplemented group (CM + CAG). The smaller attached images represent the image analyses by the software: red color corresponds to brown staining (immune complexes labelled with chromogen). (C) Graph representing the level of staining expressed as densitometric count (pixel2) normalized to the area of each section expressed in pixel2. Results were presented as the mean ± SD. ANOVA was used to evaluate the significance of the results. ** p < 0.01; **** p < 0.0001; ns, not significant. See the Materials and Methods section for details. (A,B) Objective lens, 10×; scale bar: 100 μm.

