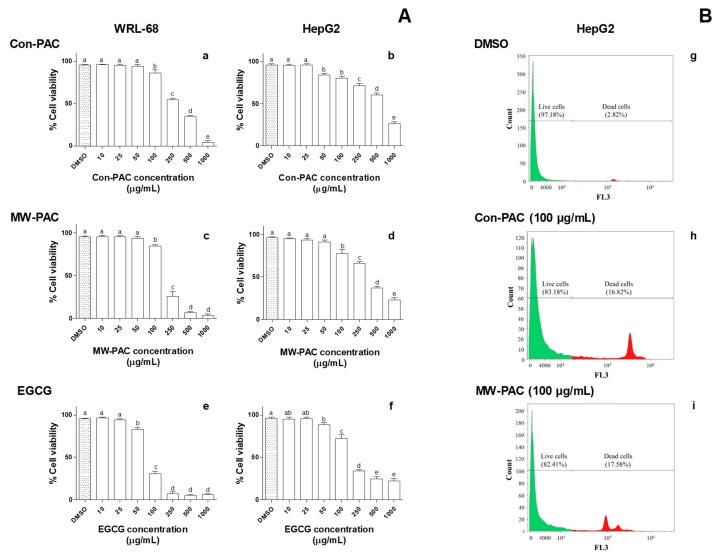
Figure 6.
Cell viability (%) of WRL-68 and HepG2 cells exposed to different concentrations of Con-PAC, MW-PAC, and EGCG measured by 7-AAD-stained flow cytometry (A) and FL3 histograms of the HepG2 cells (B) treated with 100 µg/mL of PAC. WRL-68 and HepG2 cells were exposed to 10–1000 µg/mL concentrations of Con-PAC, MW-PAC, and EGCG for 24 h. Cells were stained with 7-AAD stain in the dark (5 min) and analyzed by flow cytometry under the FL-3 filter. FACS data were processed by Kaluza Analysis (version 2.1) flow cytometry analysis software. Results presented are means ± SD of three independent experiments. Means sharing the same letter are not significantly different at the 5% level. PACs: proanthocyanidins; Con-PAC: proanthocyanidins extracted by the conventional method; MW-PAC: proanthocyanidins extracted by microwave-assisted method; EGCG, epigallocatechin gallate.

