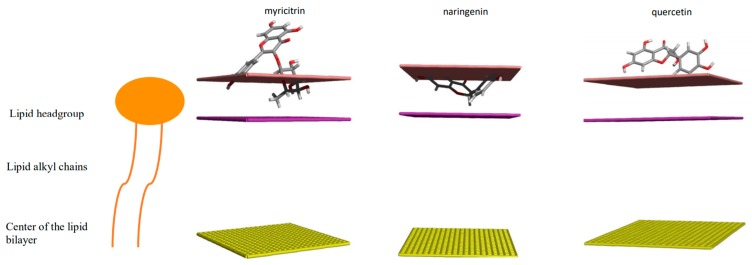
Figure 8.
Three-dimensional representation of the optimal energy position for the interaction of flavonoids calculated by the IMPALA method. The pink line represents the outer medium/membrane interface, the mauve surface is the limit between the hydrophilic heads and the hydrophobic tails of the lipids, and the yellow surface represents the center of the membrane.

