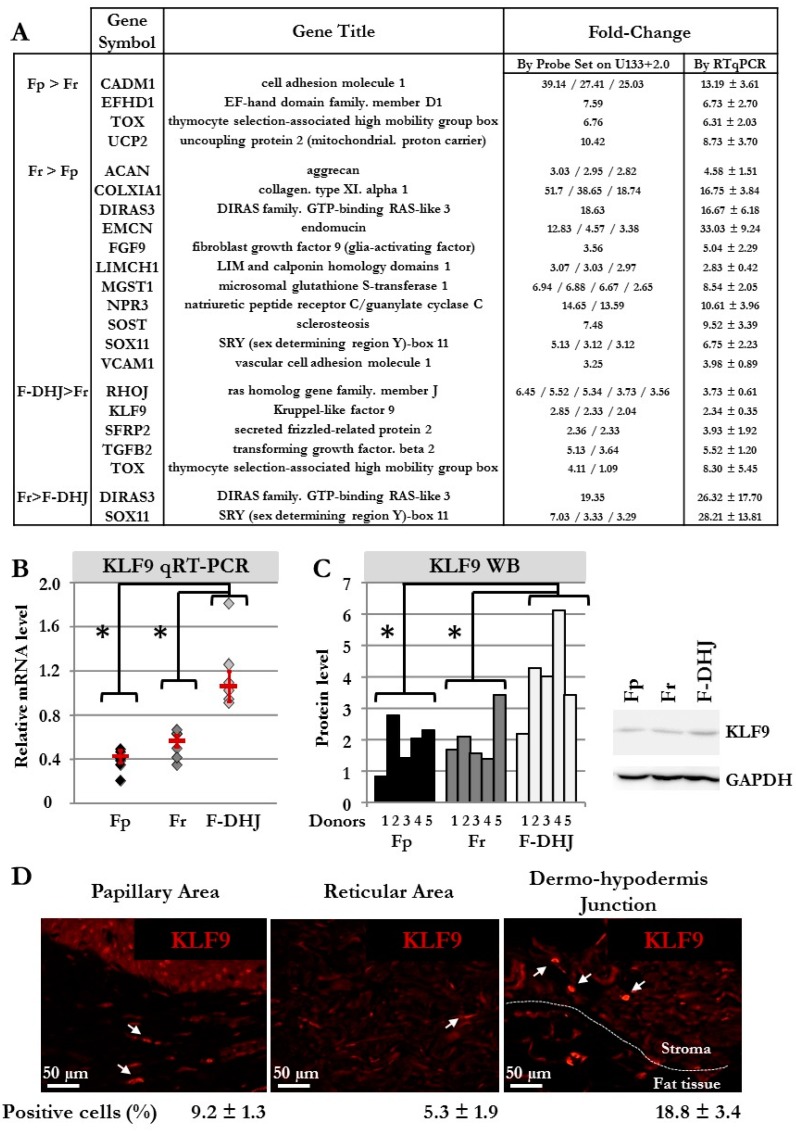
Figure 5.
Biomarker validations at mRNA and protein levels. (A) Selection of transcripts in which differential expression was confirmed by qRT-PCR in cell samples from 6 donors (donors’ ages: 22, 25, 28, 55, 61, and 65 y.o). (B) Detailed qRT-PCR comparative analysis of the KLF9 transcript in cells from the 6 donors (donors’ ages: 22, 25, 28, 55, 61, and 65 y.o). Means ± SEM are indicated (* p < 0.05, Wilcoxon test). (C) Western blot comparative analysis of the KLF9 protein in cells from the 5 donors (* p < 0.05, Wilcoxon test). A histogram detailing quantifications and a representative western blot gel is shown. (D) Immunofluorescence detection of the KLF9 protein in skin sections (breast). The percentage of KLF9+ cells was determined by observation under a fluorescence microscope of a total of 806 cells for Fp, 289 cells for Fr, and 246 cells for F-DHJ fibroblasts (skin sections from 4 donors were included in the analysis).

