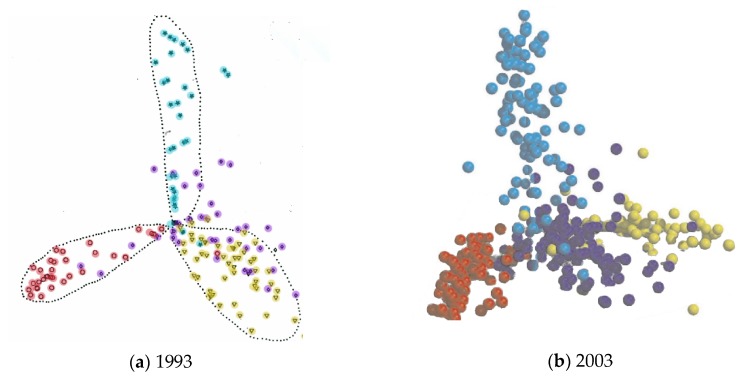
Figure 2.
Protein fold-space projections. The distances among known structures are visualised by projection into Euclidean space. The structures (dots) are coloured according to structural class: red = alpha, yellow = beta, blue = alpha/beta and purple = alpha+beta. (The latter being a smaller less well-defined class). (a) As seen by Orengo et al. (1993) [14] and (b) as seen by Hou et al. (2003) [16]. Note the overall structure has remained unchanged over ten years.

