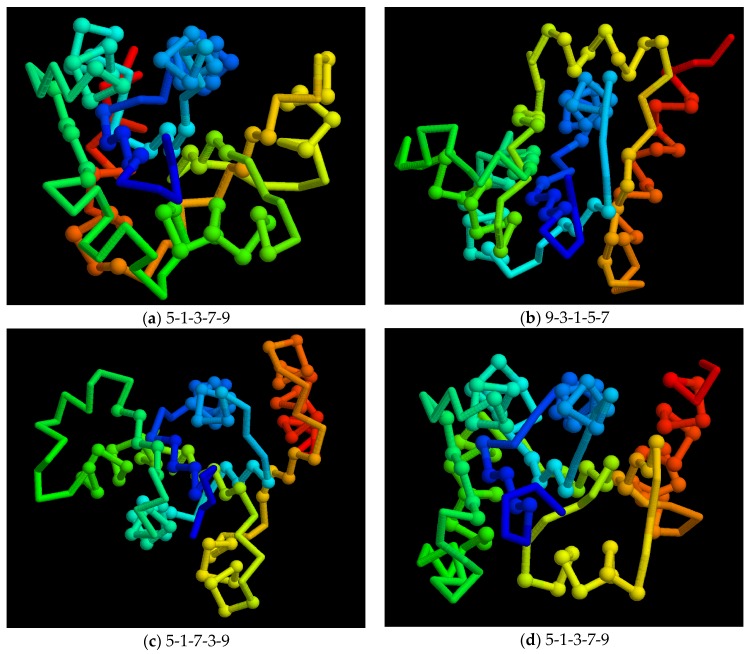
Figure 10.
Model folds: A small sample of model folds is shown as a Cα backbone trace (as in Figure 9b) with the chain coloured blue to red corresponding to amino to carboxy terminus. Residues in secondary structures are marked as a small sphere. The order of the strands in the sheet is shown below each fold. Note that even though folds (a) and (d) have the same strand order, the strand direction is not recorded and these models have different folds.

