Figure 6.
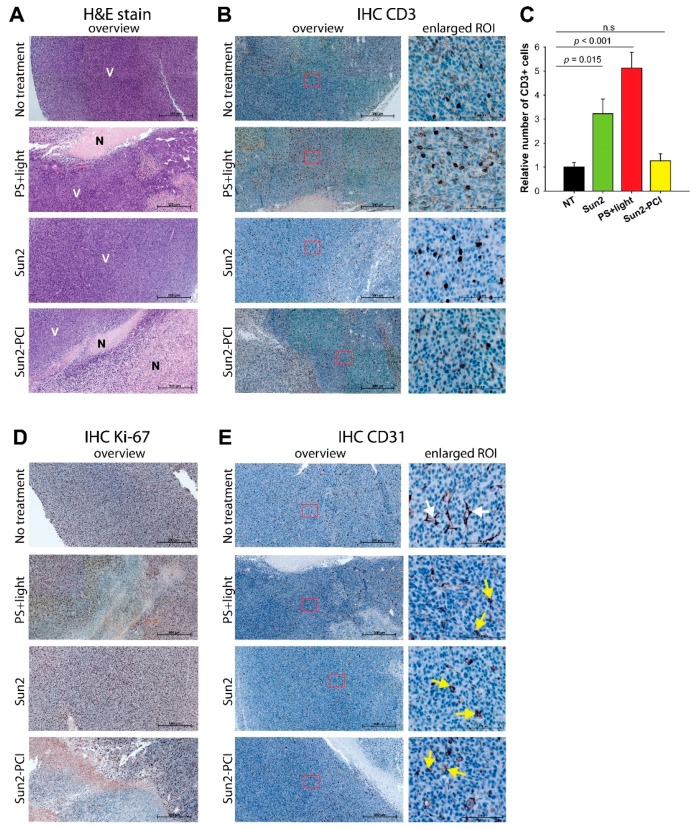
IHC of CT26. WT tumor tissue sections from BALB/c mice treated with the Sun-2-PCI procedure. Representative images of CT26.WT tumor sections, following PS + light, Sun2 or Sun2-PCI treatment. (a) H&E stain (N: necrotic V: viable) and (b) CD3 stain. (c) Quantification of CD3 staining based on three ROIs in each tumor (two tumors in each group). Mean ± S.E. Significant difference established by one-way ANOVA test followed by pair wise multiple comparison procedure. (d) Ki-67 stain and (e) CD31 stain. Arrows indicate intact (white) and collapsed (yellow) vessels. Magnification in overview 20×, scale bar: 500 µm. ROI: region of interest.

