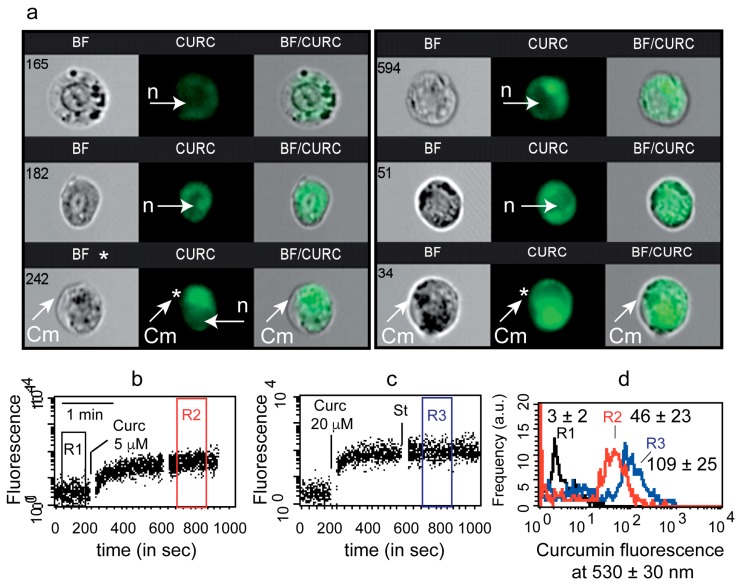
Figure 1.
Qualitative analysis of curcumin staining of cells. (a)—Image flow cytometry of curcumin uptake by Huh7 cells. White arrows indicate either nuclei (n) or cytoplasmic membrane (Cm). (b,c)—Cell fluorescence over time before and after 5 µM curcumin (b) or 20 µM curcumin (c) was added to the tube. (d)—Curcumin fluorescence intensity of different regions of previous kinetic measurements. The mean fluorescence values of curcumin in R2 and R3 are directly noted on the histograms.

