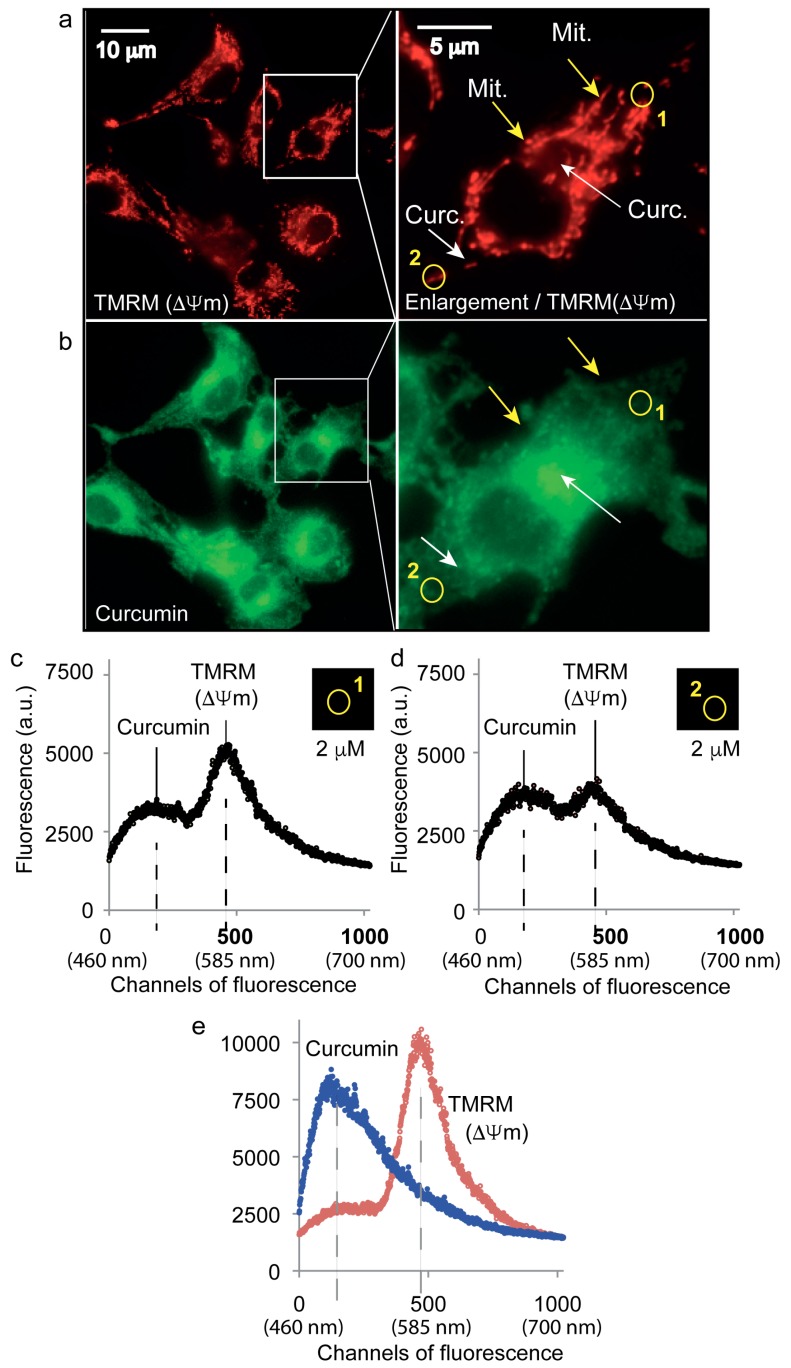
Figure 2.
Intracellular curcumin is not found in the mitochondrial network. (a)—Fluorescence microscopy of the mitochondrial specific dye, TMRM, at 585 ± 42 nm after excitation at 488 nm. (b)—luorescence microscopy of curcumin at 530 ± 30 nm after excitation at 488 nm. White arrows indicate regions with high curcumin fluorescence, yellow arrows indicate regions with a high density of mitochondria. (c,d)—Microspectrofluorimetric spectra at selected regions 1 and 2 (shown in a,b). Panels (c,d) are related to the areas named 1 and 2 in (a,b). The relative values of curcumin and TMRM in areas 1 and 2 are evaluated at the points of maximum emission of curcumin (530 nm) and TMRM (585 nm). (e)—Microspectrofluorimetric spectra of curcumin or TMRM alone showed peaks around 530 nm and 585, respectively, in their free forms.

