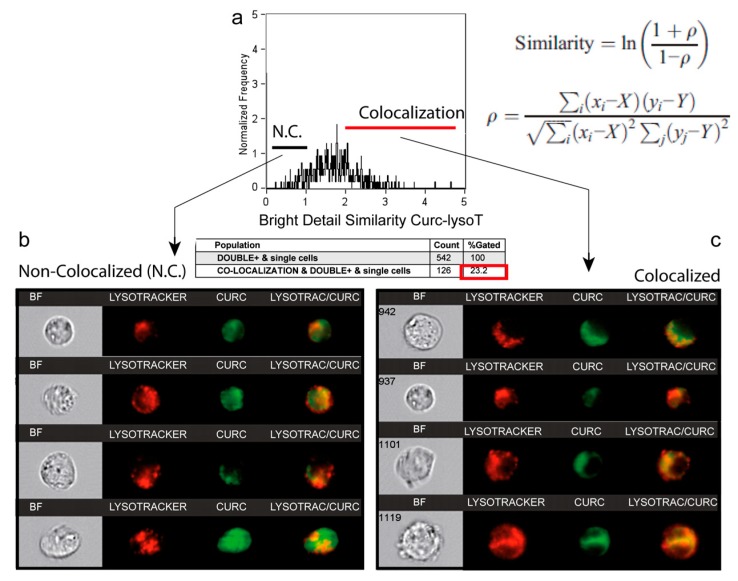
Figure 5.
Similarity analysis for correlation between curcumin fluorescence and LysoTracker Red. (a) Analysis of the colocalization of curcumin and LysoTracker red (lysosomes) by using the Similarity Score included in IDEAS 6.0 software™ (Amnis). This score, a log-transformed Pearson’s correlation coefficient between the pixels of two image pairs, provides a measure of the degree of co-localization by measuring the pixel intensity correlation between the curcumin and LysoTracker images. Analysis performed on 542 cells. Cells that were permeable to TO-PRO-3 iodide and/or debris were excluded from the analysis together with cellular aggregates. This corresponds to 5 μM curcumin and 3-h incubation plus 10-min staining at 37 °C with 100 nM LysoTracker Green. (b) Selection of some images that correspond to cells (from the histogram in a) where there is no strict correlation between curcumin and LysoTracker Red. (c) Selection of some images corresponding to the cells presenting full colocalization of the two probes from the ahistogram in (a).

