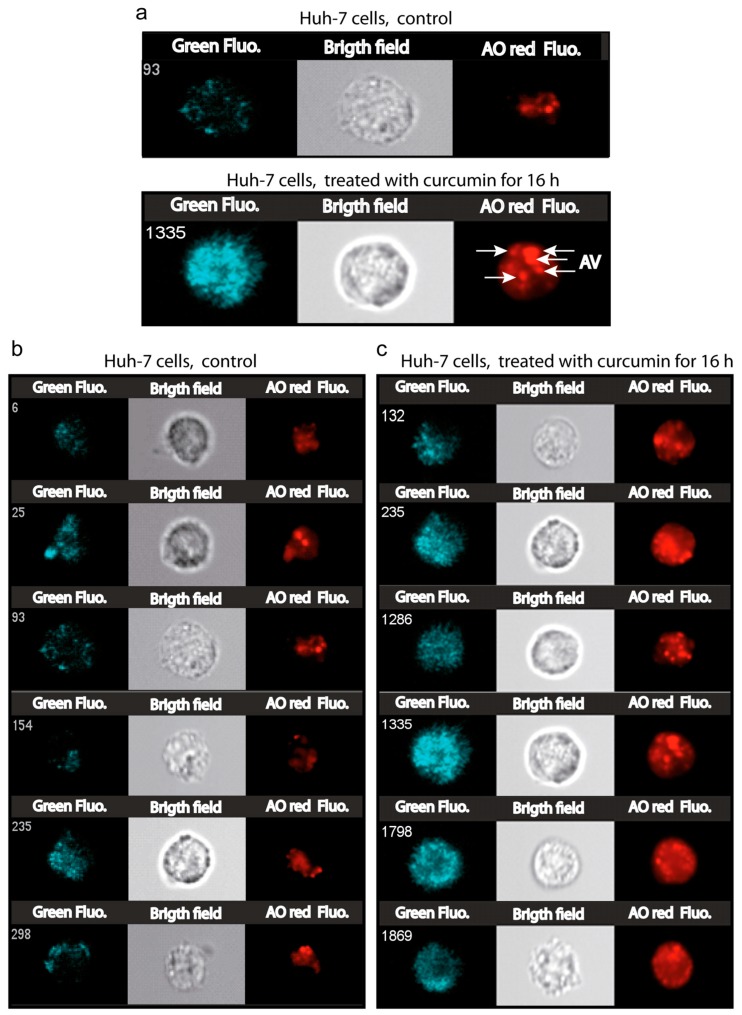
Figure 8.
Image cytometry of the acidic compartment of Huh-7 cells treated with 5 μM curcumin for 16 h. The measurements were done with an Amnis ImageStream100 (Amnis, Merck Millipore) imaging flow cytometer. (a)—The images presented are dark field (SSC, Ch01), bright field (Ch02 gray) and the red channel (Ch04) for the red nonyl acridine fluorescence from the NAO red aggregates in a low pH environment. Control Huh-7 cells with lysosome staining essentially and cells treated with curcumin where staining is accentuated in lysosomes, but also in acidic autophagic vacuoles. (b)—same as in a, exhibiting six distinct cell staining experiments and (c) for 16-h treatment with 5 μM curcumin.

