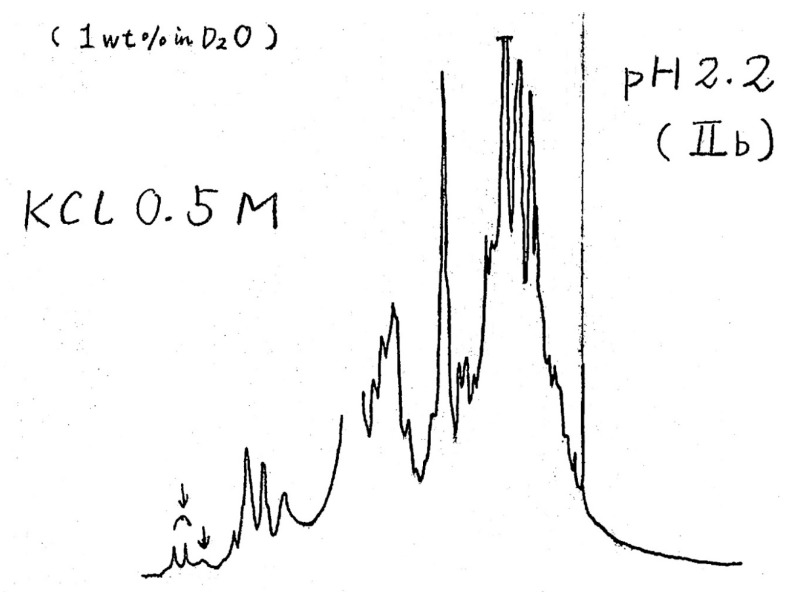
Figure 1.
A copy of the original 1D 1H-NMR spectrum of Cytochrome c in the Molten Globule state (initially called state IIb in Wada’s laboratory). The spectrum was measured on December 4th, 1980, with a 360 MHz NMR spectrometer at the Institute for Protein Research, Osaka University. The arrows on the left side show peaks assigned to aromatic protons exhibiting features similar to those in a random coil state (by courtesy of Prof. K. Nagayama).

