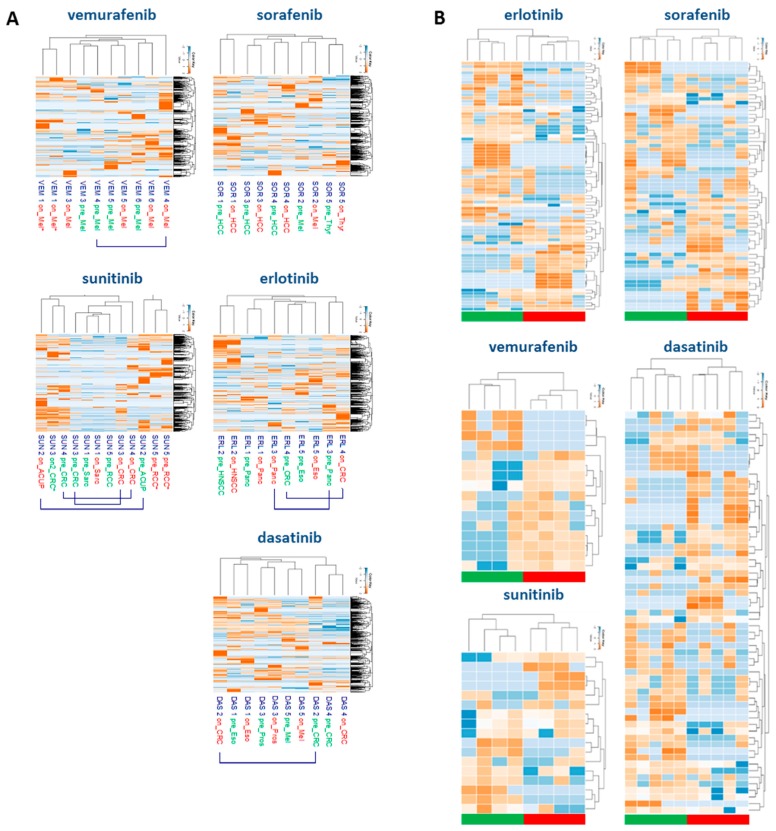
Figure 2.
Hierarchical cluster analyses of pTyr-phosphoproteomics data. (A) Unsupervised hierarchical clustering of the pTyr-phosphoproteome in pre- and on-treatment tumor biopsies. Cluster analysis based on log10-transformed phosphopeptide intensities (red: high abundance, blue: low abundance) shows that samples from individual patients tend to cluster, except for the sunitinib cohort due to limited protein input. Pre- and on-treatment samples are labeled green and red, respectively. VEM1*, SUN5* denote workflow replicates. (B) Supervised hierarchical clustering of highly regulated phosphopeptides. Cluster analysis based on up- or downregulated phosphopeptides with a fold-change (intensity on-tx/pre-tx) of > 5 of observed phosphopeptide intensities, in at least 3 patients per cohort. Green blocks indicate pre-treatment samples, red blocks on-treatment samples. Separation of pre- and on-treatment groups is shown for all 5 PKI cohorts.

