Figure 2.
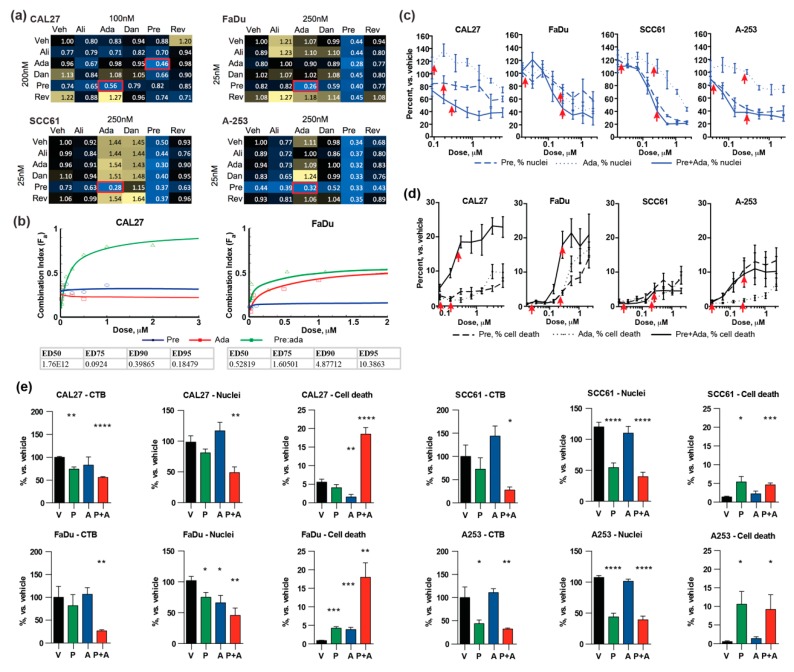
Evaluation of combination effect of selected cell cycle inhibitors. (a) Heatmaps representing values from CellTiterBlue (CTB) assays for combinations of the indicated targeted drugs, at the concentrations indicated. Values indicate reduction in cell metabolic activity normalized to vehicle control; blue, positive combination activity; yellow, antagonistic combination activity; red boxes, optimal combination; (b) combination index (CI) calculation results for the CAL27 and FaDu cell lines to assess synergistic effects of pre:ada drug combination; (c,d) dose response curves indicating viable cells (based on nuclear count) (c) and inviable cells (based on failure to exclude propidium iodide) (d). Arrows indicate concentrations comparable to those shown in CTB assays in (a); (e) Comparison of results from assays in (a–d) at drug concentrations used in (a). All graphs: *, p ≤ 0.05; **, p ≤ 0.01; ***, p ≤ 0.001; ****, p ≤ 0.0001 relative to vehicle controls.

