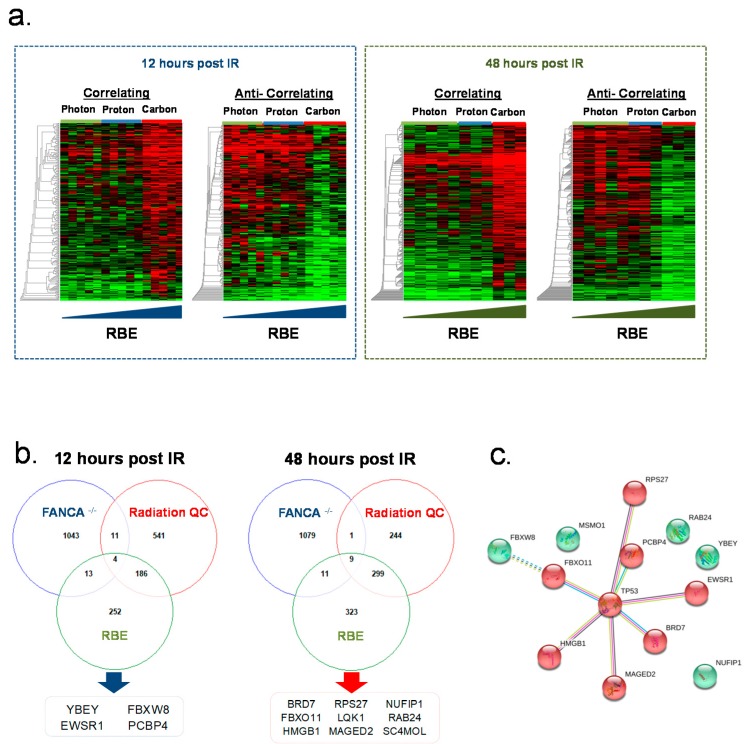
Figure 4.
Gene expression changes as a function of Fanconi anemia, radiation quality and RBE. (a) gene expression heatmaps of genes which are correlated or anti-correlated with the higher RBE of carbon ions for the 12 and 48 h timepoint (p < 0.05, PTM). (b) The Venn diagram represent the overlap of genes modulated by FA, radiation qualities (RQ), and relative biological effectiveness (RBE) status for each timepoint resembling the core set of genes modulating FA response to radiation. (c) Genes which were modulated as a function of FA, RQ and RBE were analyzed with the STRING Search Tool for the Retrieval of Interacting Genes/Proteins. Represented are genes which interact with each other over the TP53 access.

