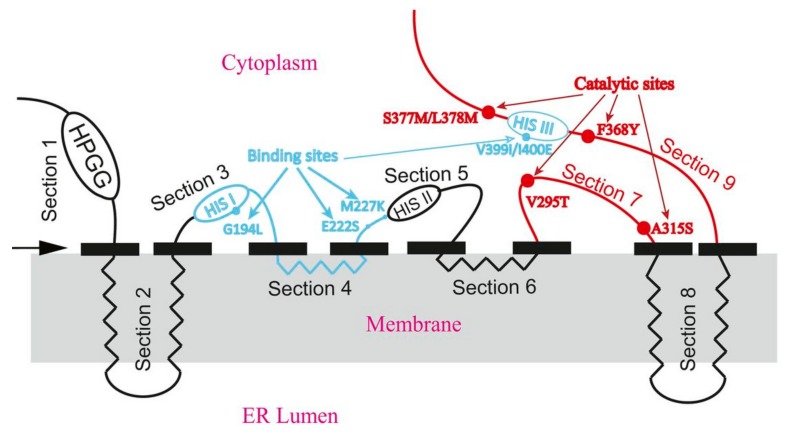
Figure 3.
The predicted topology model of Δ6 Fads2. The black solid rectangles indicate boundaries of domains. Four alpha-helices span the membrane. The blue lines and blue dots indicate the areas and sites implicated in substrate specificity, red lines and red dots indicate the areas and sites important for catalytic activity, respectively. ER lumen: endoplasmic reticulum lumen. HIS I, HIS II and HIS III: histidine rich motifs. Modified from (Shi et al., 2018).

