Figure 5.
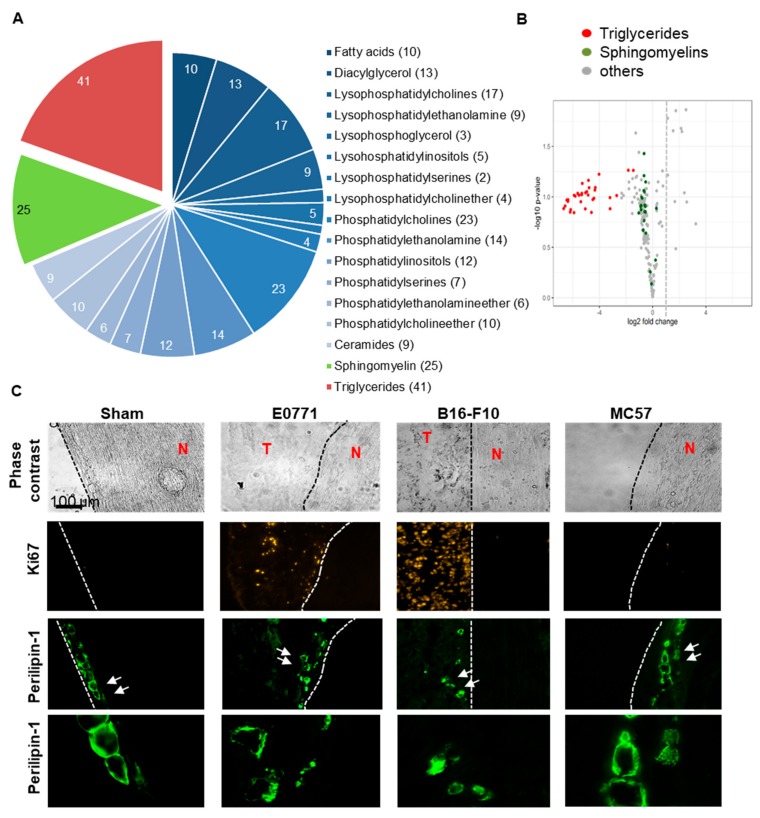
Localization and lipid content of epineural adipocytes is changed by neighboring tumors. (A) Lipidomic comparison of ipsi- and contralateral sciatic nerves 14 days after E0771 tumor cell injection (n = 5). Shown are lipid classes of the 206 analyzed lipids. Numbers in the chart indicate the number of different lipids detected per lipid class. (B) Vulcano plot showing the regulation of the lipids in the sciatic nerves from the ipsilateral side in comparison to the contralateral side. (C) Immunohistochemical images showing adipocytes located in the outer layers of sciatic nerves and Ki67 staining for proliferative cells. Adipocytes in sciatic nerves injected with E0771 (d14), B16-F10 (d9) or MC57 (d19) show irregular perilipin-1 staining. The white arrows show cells, which are magnified in the bottom panel. White arrows depict adipocytes, where a shrinking of the cell or an even distribution of perilipin-1 throughout the cell is visible. T, tumor tissue; N, sciatic nerve.

