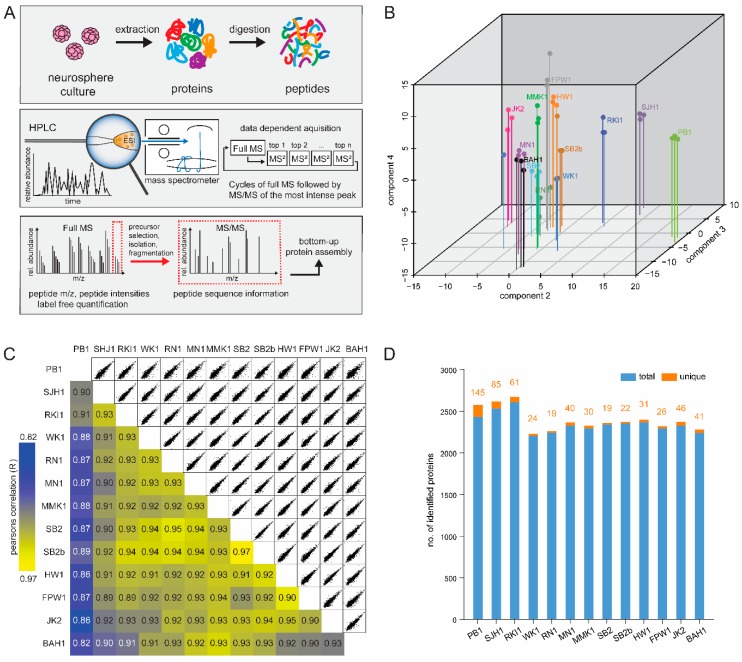
Figure 1.
Proteome mapping of 13 Q-cell cell lines. (A) Graphical illustration of the workflow for glioblastoma (GBM) cell line proteome analysis. GBM primary cell lines were cultured as neurospheres, lysed in SDS-based buffer, trypsin digested by in-solution digestion in biological triplicate. LC–MS/MS with 4 hour runs and CID fragmentation were performed in the LTQ-Orbitrap Elite. (B) 3D-PCA plot. The proteome of thirteen cell lines measured in triplicates segregated into major cell types showing well-correlated triplicates within a cell line. (C) The matrix of 78 correlation plots revealed very high correlations between protein intensities in triplicates (Pearson correlation coefficient 0.82–0.97 between cell types). The colour code follows the indicated values of the correlation coefficient. (D) A bar chart showing the number of total proteins identified in each of the cell lines with false identification rate (FDR) of 1%.

