Figure 4.
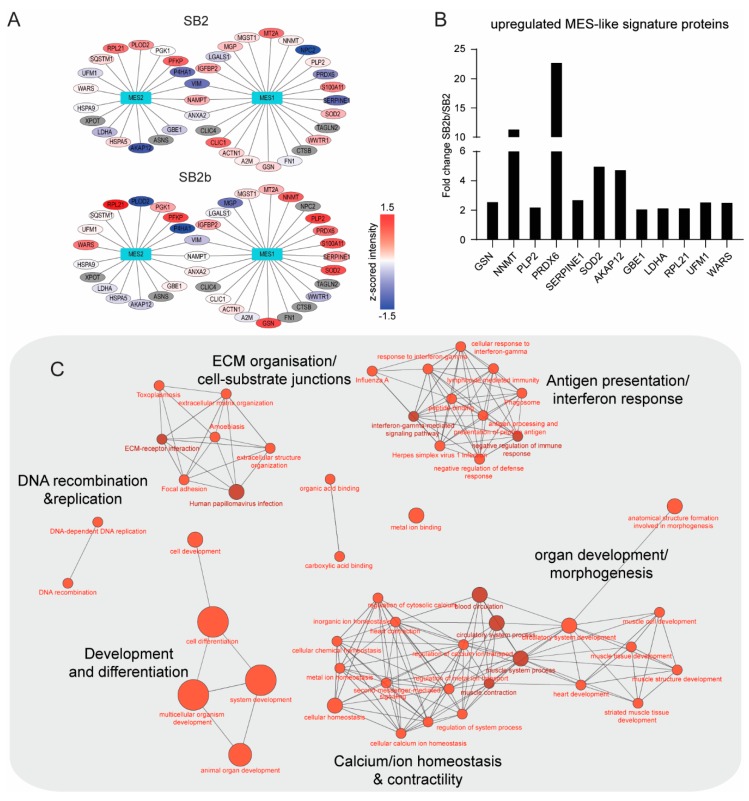
Changing cell-states in a pair-matched recurrent model. (A) z-scored expression values of genes that contribute to MES1-like and MES2-like metamodules (gene list from [9]). Colour key: red, high expression; blue, low expression; grey, no expression. (B) A bar graph of MES-1-like and MES-2-like genes with >2-fold increase in expression in the recurrent model (SB2b) when compared with the primary model (SB2). (C) Kyoto Encyclopedia of Genes and Genomes (KEGG) pathways and gene ontology (GO) molecular function terms enriched in the top 100 most regulated proteins in the recurrent SB2b model when compared to the primary SB2B model. Node size reflects the number of regulated proteins associated with a particular term/pathway. Node colour intensity increases with increasing significance of term enrichment.

