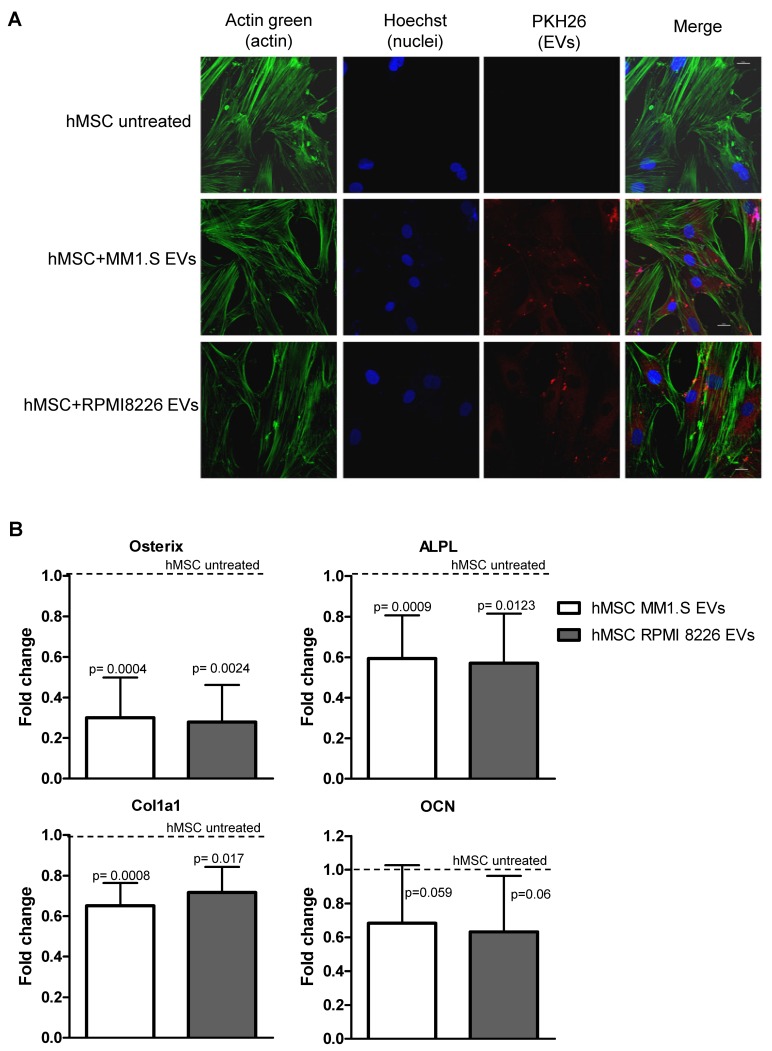
Figure 1.
(A) Cellular internalization of MM1.S and RPMI 8226-derived EVs into hMSCs was analyzed by confocal microscopy. HMSCs were incubated for 4 h with MM-EVs labeled with PKH26 (red). HMSCs were stained with ActinGreen (green), nuclear counterstaining was performed using Hoescht (blue). Samples were analyzed at the confocal microscope (scale bar = 20µm). (B) The Real-Time PCR analyses of Osterix, ALPL, Col1A1 and OCN were performed on hMSCs maintained in the osteogenic medium after 10 days of treatment with MM1.S and RMPI 8226-derived EVs. Data were normalized for β-actin and values are expressed as Fold Change in gene expression that occurred in cells treated with EVs versus untreated hMSCs (dotted line). The statistical significance of the differences was analyzed using a two-tailed Student’s t-test.

