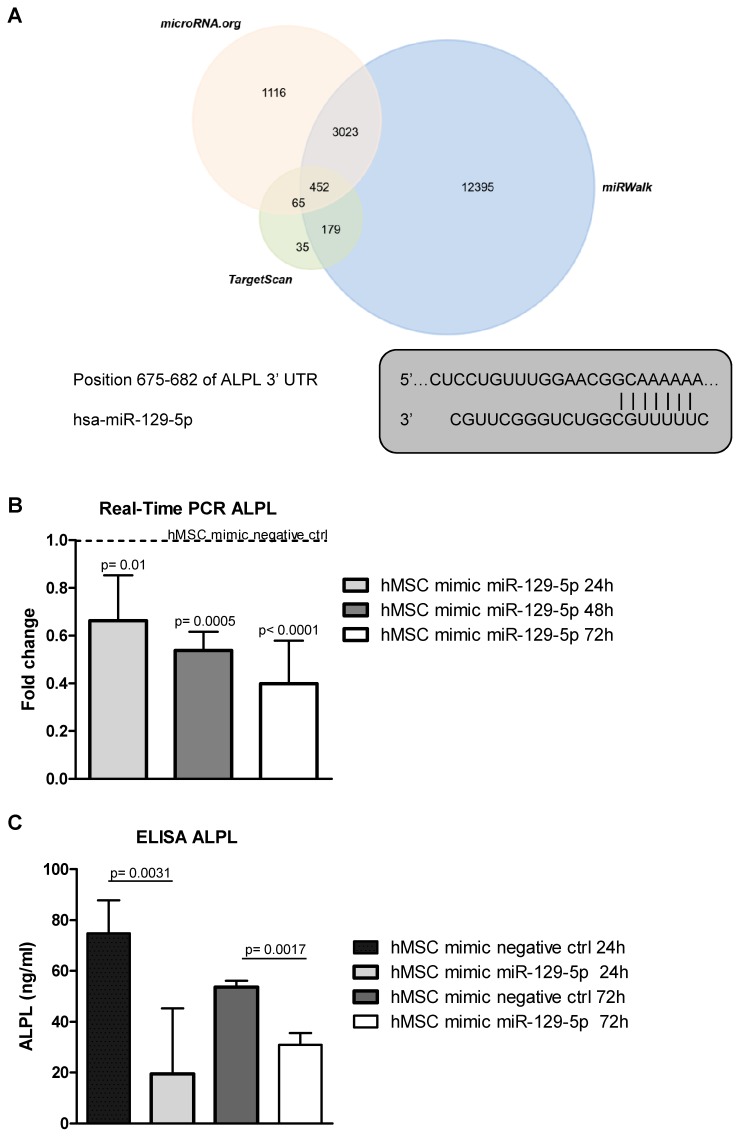
Figure 5.
(A, upper panel) The target genes of hsa-miR-129-5p were predicted using three different bioinformatics databases (Target scan, miRWalk and microRNA.org). TheVenn diagram was generated using the FunRich tool available online. (A, lower panel) The sequence alignment between miR-129-5p and the 3′-UTR of ALPL mRNA predicted by TargetScan. (B) The Real-time PCR analysis of ALPL in hMSCs transfected for 24, 48 and 72h with miR-129-5p mimic. Data were normalized for β-actin. Values are expressed as Fold Change in gene expression that occurred in cells transfected with miR-129-5p mimic versus hMSCs transfected with mimic negative ctrl for each time point (dotted line). The statistical significance of the differences was analyzed using a two-tailed Student’s t-test. (C) ALPL release was quantified by ELISA in the supernatant of hMSCs transfected for 24 and 72h with miR-129-5p mimic and with mimic negative ctrl. Values are reported as ALPL concentration in ng/mL. The statistical significance of the differences was analyzed using a two-tailed Student’s t-test.

