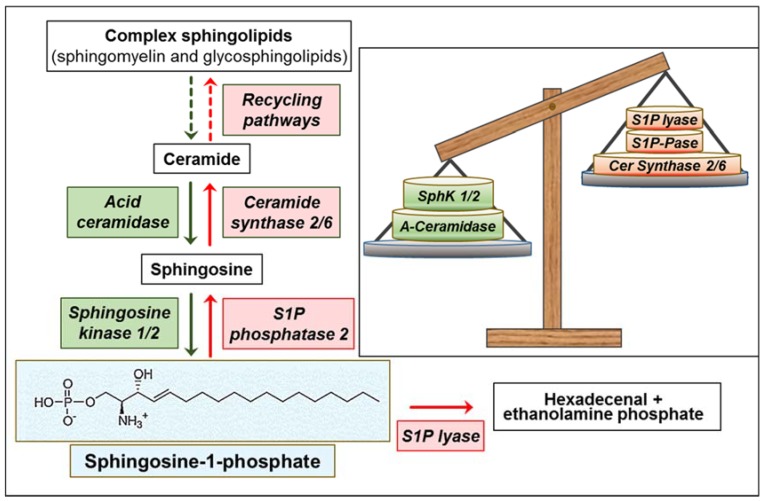
Figure 1.
Overview of sphingosine-1-phosphate (S1P) metabolism and its alterations in glioblastoma (GBM). Green: overexpressed/upregulated enzymes; red: downregulated enzymes. Green and red arrows, increased and decreased enzyme activity, respectively. The insert shows the imbalance between enzymes involved in S1P formation (green) and degradation (red).

