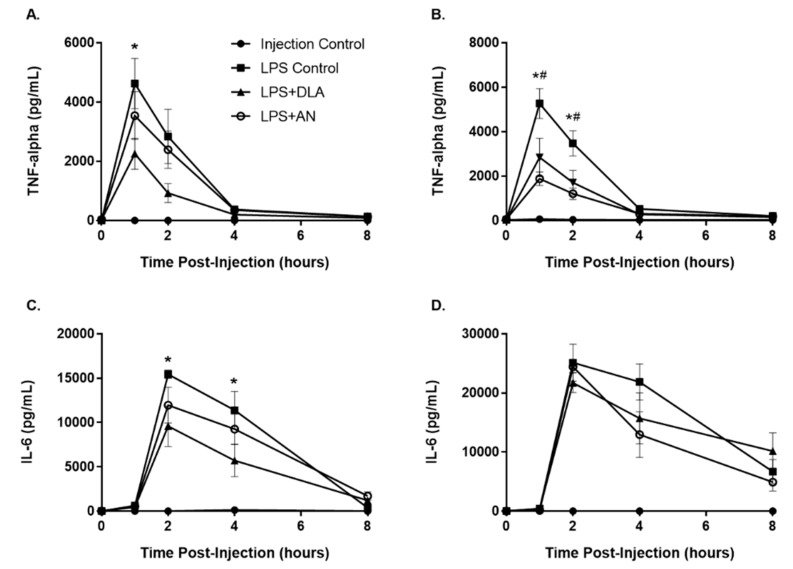
Figure 6.
Production of proinflammatory cytokines TNF-α and IL-6 in male (A,C) and female (B,D) rats after LPS challenge and treatment with either pure artemisinin (AN) or DLA (equal artemisinin doses). n = 5–6 for experimental conditions, n = 3 for injection control; error bars = SEM; *, p ≤ 0.05 when comparing LPS+DLA to LPS Control; #, p ≤ 0.05 when comparing LPS+AN to LPS Control.

