Figure 3.
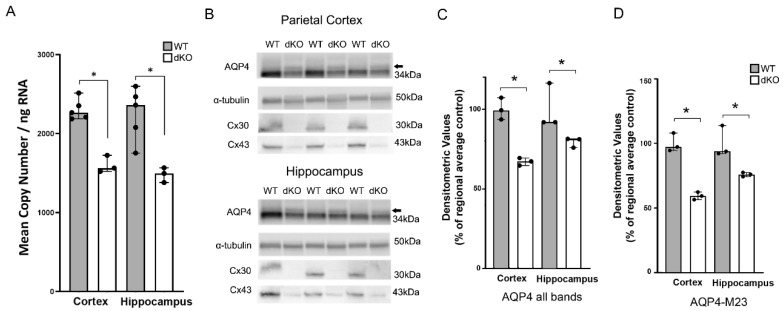
RT-qPCR and Western blot analysis of AQP4 in WT and Cx43/30 dKO mice. (A) RT-qPCR analysis of parietal cortex and hippocampus in WT and Cx43/30 dKO mice. Graph illustrates quantification of Aqp4 mRNA. Significant decrease in the mRNA level of Aqp4 was found in the samples of Gja1 and Gjb6 dKO compared to WT mice in each region. A combination of Gapdh and Hprt1 was used for normalization of copy numbers. * Significant difference according to independent samples t-test; n = 3 for each genotype; error bars SEM; p < 0.05. (B) Representative immunoblots of total protein lysates from hippocampus and parietal cortex for AQP4 in WT and Cx43/30 dKO animals. Two major bands detected in homogenates from both regions correspond to M1 (arrow) and M23 isoforms of AQP4. α-tubulin was used as the loading control. dKO animals are negative for Cx30 and Cx43 protein. (C) Quantitation of total AQP4 in cortex and hippocampus of WT and Cx43/30 dKO mice. Significant decrease in total AQP4 protein was found in both regions of Cx43/30 dKO animals compared to WT mice. (D) Quantitation of the AQP4 M23 isoform in cortex and hippocampus of WT and Cx43/30 dKO mice. Significant decrease in the AQP4 M23 was found in both regions of Cx43/30 dKO animals compared to WT. Values are presented as average of the respective wild type regional control. Individual values are presented as black dots. * Significant difference according to non-parametric Kruskal–Wallis test; n = 3 for each genotype; error bars indicate medians with 95% CI, p < 0.05.

