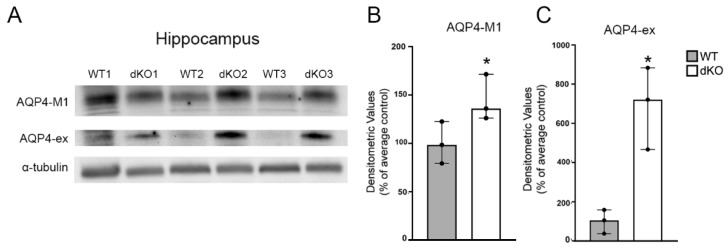
Figure 4.
Immunoblots and quantification of total protein lysates from hippocampus of WT and Cx43/30 dKO mice. (A) Representative immunoblots of total protein lysates from hippocampus for AQP4-M1 and AQP4-ex in WT and Cx43/30 dKO animals. α-tubulin was used as the loading control. (B,C) Graphs illustrate densitometric analysis of AQP4-M1 and AQP4-ex immunoblotts of hippocampus of WT and Cx43/30 dKO mice. A significant increase in AQP4-M1 and AQP4-ex protein isoforms was found in Cx43/30 dKO animals compared to WT. Values are presented as average of the respective wild type regional control *significant difference with non-parametric Kruskal–Wallis test; n = 3 for each genotype; error bars medians with 95% CI, p < 0.05.

