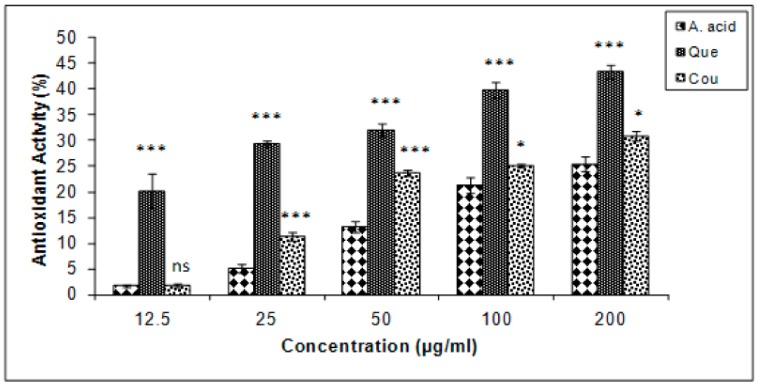
Figure 5.
β carotene bleaching inhibition (%) in quercetin and coumarin as compared to the control; ascorbic acid. Each vertical bar represents the mean ± S.E.M. (n = 3), *** p < 0.001, ** p < 0.01 and * p < 0.05 as compared to the respective control values. A. acid, ascorbic acid; Que, quercetin; Cou, coumarin.

