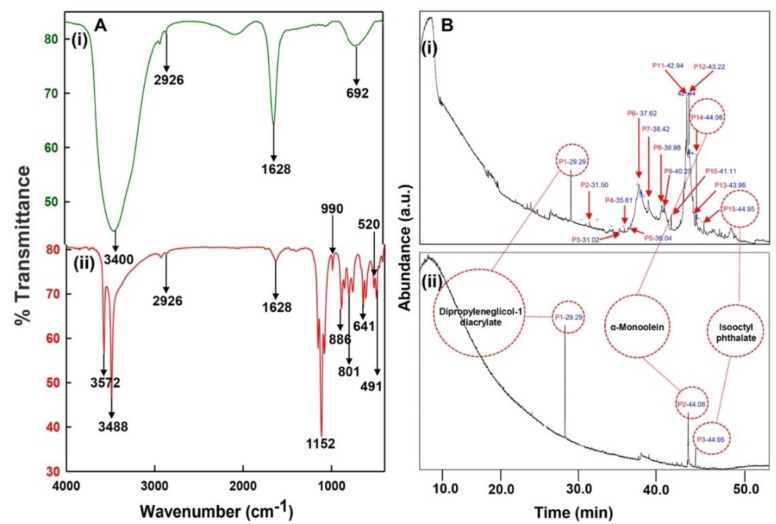
Figure 4.
FTIR and GC-MS analyses of CLE and CLE-CuONPs. (A) comparison of FTIR spectra of CLE (spectrum-i) and CLE-CuONPs (spectrum-ii); (B) GC-MS analysis (spectrum-i) shows a typical chromatogram of CLE indicating 15 peaks of different bio-actives. Spectrum-ii shows three CLE compounds: dipropyleneglycol-1 diacrylate, α-monoolein, and iso-octyl phthalate associated with CLE-CuONPs.

