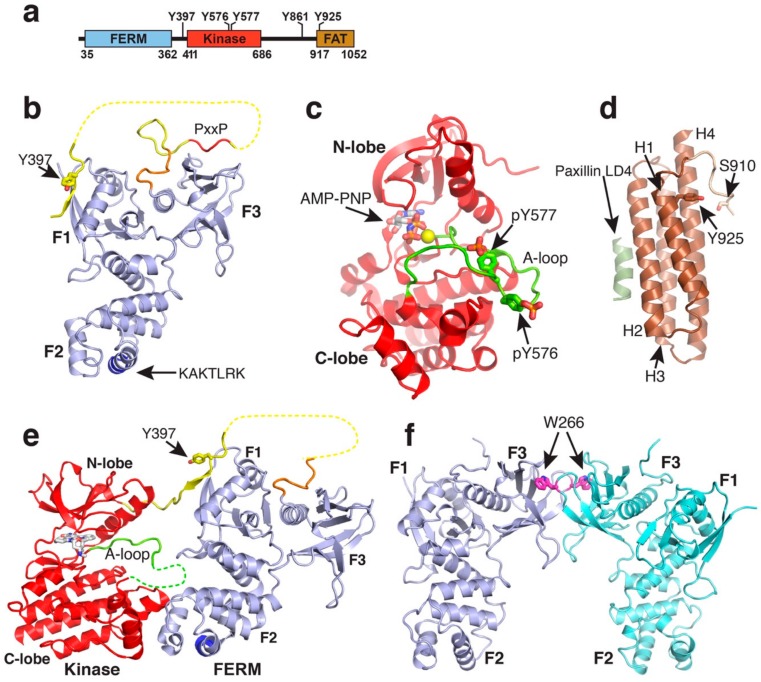
Figure 1.
Structures of FAK domains. (a) Schematic domain structure of FAK. Domain boundaries and regulatory phosphorylation sites are indicated. (b) Crystal structure of the FAK FERM domain containing the F1, F1 and F3 lobes (PDB accession 2AL6). The 10 C-terminal residues integral to the FAK FERM domain, but not in ERM FERM domains, are coloured in orange. The linker is in yellow with the PxxP motif known to interact with the Src SH3 domain in red. The Y397 autophosphorylation site in the linker and the KAKTLRK motif in the F2 lobe (blue) are labelled. (c) Structure of the active FAK kinase domain with Y576 and Y577 in the activation loop (A-loop) phosphorylated (PDB accession 2J0L). The A-loop is coloured in green. A non-hydrolysable ATP analogue (AMP-PNP) and a Mg2+ ion (yellow sphere) are bound to the active site. (d) Structure of the FAT domain bound to the paxillin LD4 peptide (PDB accession 1OW7). The paxillin LD4 peptide is in olive green and the N-terminal FAT extension in tan. Helices H1-H4 and the S910 and Y925 phosphorylation sites are labelled. (e) Crystal structure of the FERM-kinase region of FAK in the autoinhibited conformation (PDB accession 2J0J). Colouring is as in panels (a,b). (f) FERM dimer mediated by W266 interactions in the F3 lobe as observed in various crystal structures (shown from PDB accession 2AEH).

