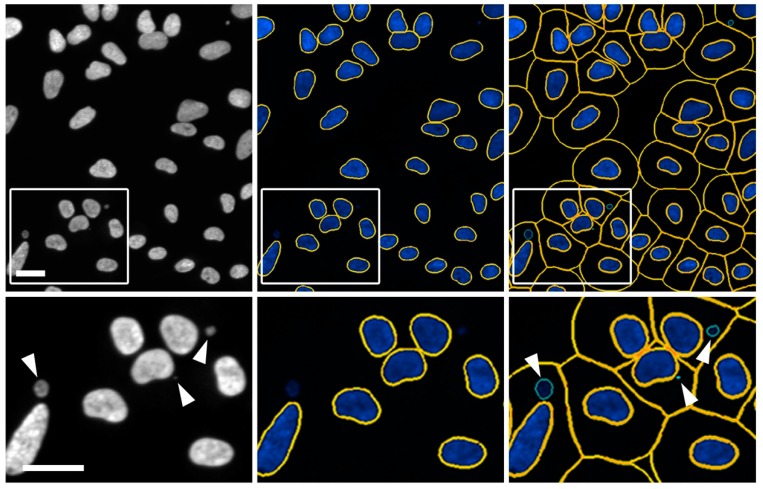
Figure 1.
Automated image segmentation and spot detection of micronuclei. Representative images presenting the scQuantIM approach used to detect micronuclei (arrowheads; bottom left image) labelled with Hoechst 33342 in FT246 cells (SMC1A silenced conditions). Note that only a portion of a 20× image (i.e., crop image) is presented in the top row, while the bottom row presents the magnified region identified by the bounding box. Gen5 software segments images by applying a primary (nuclear) mask (middle images; yellow lines) and a secondary (cell body) mask (right images; yellow lines), prior to applying spot detection to identify micronuclei (right images; green lines). Scale bar represents 30 μm.

