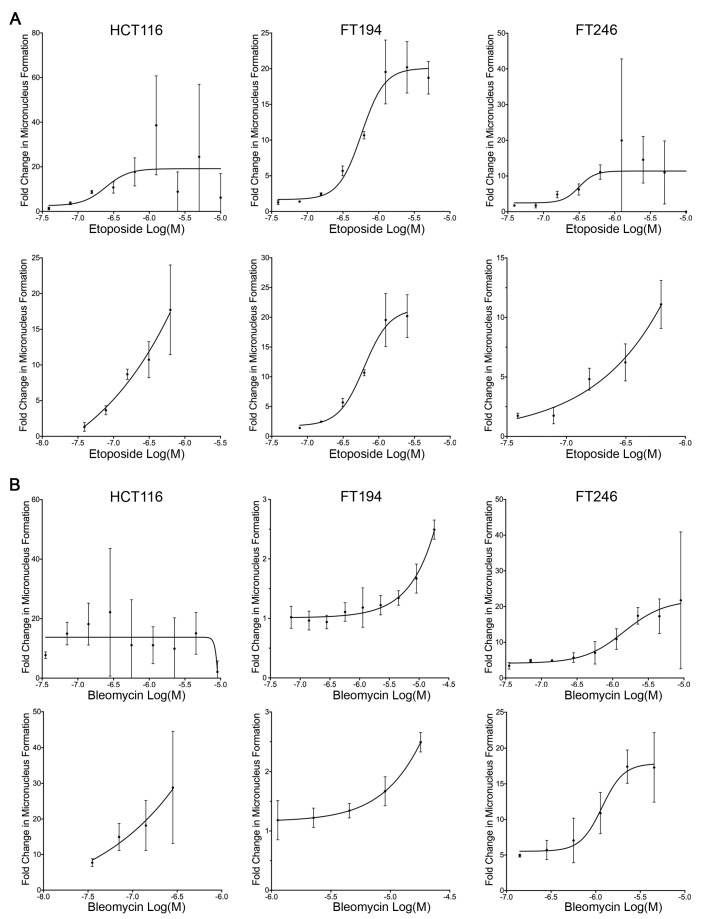
Figure 3.
Increasing concentrations of etoposide and bleomycin correspond to increases in micronucleus formation. (A) Increasing concentrations of etoposide correspond to increases in micronucleus formation in HCT116 (left), FT194 (middle), and FT246 (right) cells. The (top) graphs present full dose ranges, while the (bottom) graphs present refined ranges. Presented are the mean ± SD for each concentration relative to the vehicle control. Each experimental condition was performed in triplicate. (B) Increasing concentrations of bleomycin induce increases in micronucleus formation in HCT116 (left), FT194 (middle), and FT246 (right) cells. (Top) graphs present full dose ranges, while (bottom) graphs present optimal ranges. Presented are the mean ± SD relative to the vehicle control for the experiments performed in triplicate.

