Figure 2.
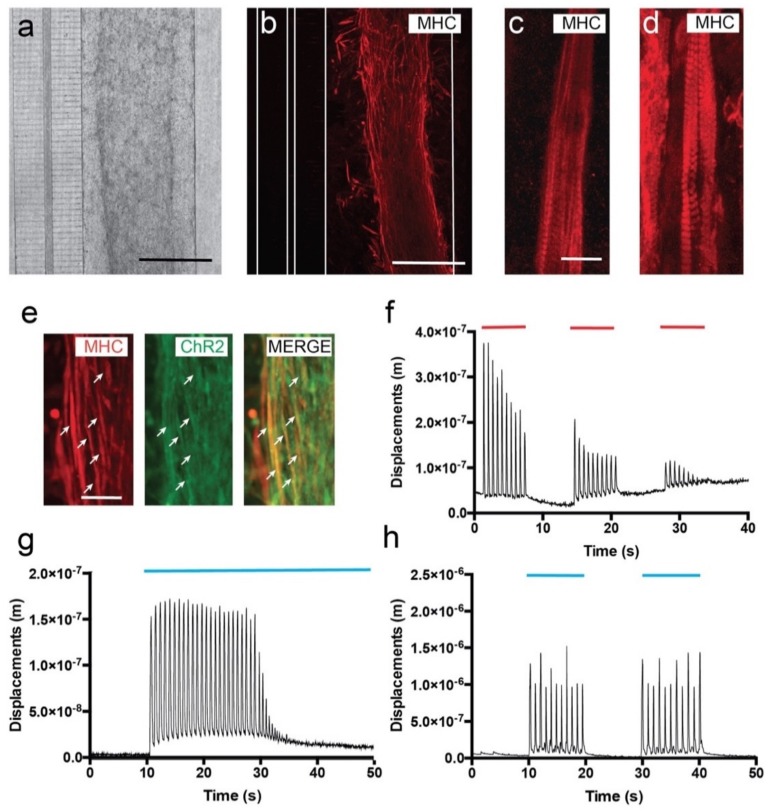
Development and functional properties of cultured C2C12-ChR2 cells in microfluidic devices. (a) Low magnification phase contrast (a) and fluorescence after the immunohistochemical detection of the MHC (b) micrographs illustrating differentiating C2C12 myoblasts in the right chamber 3 days after seeding. As a result of the fixation and the immunohistochemical procedure, a shrinkage of the hydrogel could be observed. Please note that the connecting microchannels and the transversal axotomy channel can be seen on the left in (a). The microfluidic limits of these microchannels are labelled as white lines in (b). (c,d) Myotube differentiation of C2C12-ChR2 myoblasts at different in vitro timepoints: 3 (c) and 7 days (d). Note the increasing presence of the MHC-positive labelling of sarcomers in the differentiating myotubes in (d) with respect to (c). (e) Fluorescence photomicrographs illustrating double-labelled (ChR2-MHC, arrows) differentiating myotubes in the chamber. (f) Graph illustrating one example of the displacement measurements (y-axis) of differentiated C2C12-ChR2 myotubes after electrical activation (red lines) over time (x-axis). (g,h) Graphs illustrating one example of the displacement measurements (y-axis) of differentiated C2C12-ChR2 myotubes after optogenetic activation (blue) in continuous (g) or pulsatile (h) illumination (blue lines in g and h) (see Material and Methods for details of analysis and Results for the statistical analysis). Scale bars: (a,b) = 100 µm, (c) = 50 µm, (e) = 25 µm.

