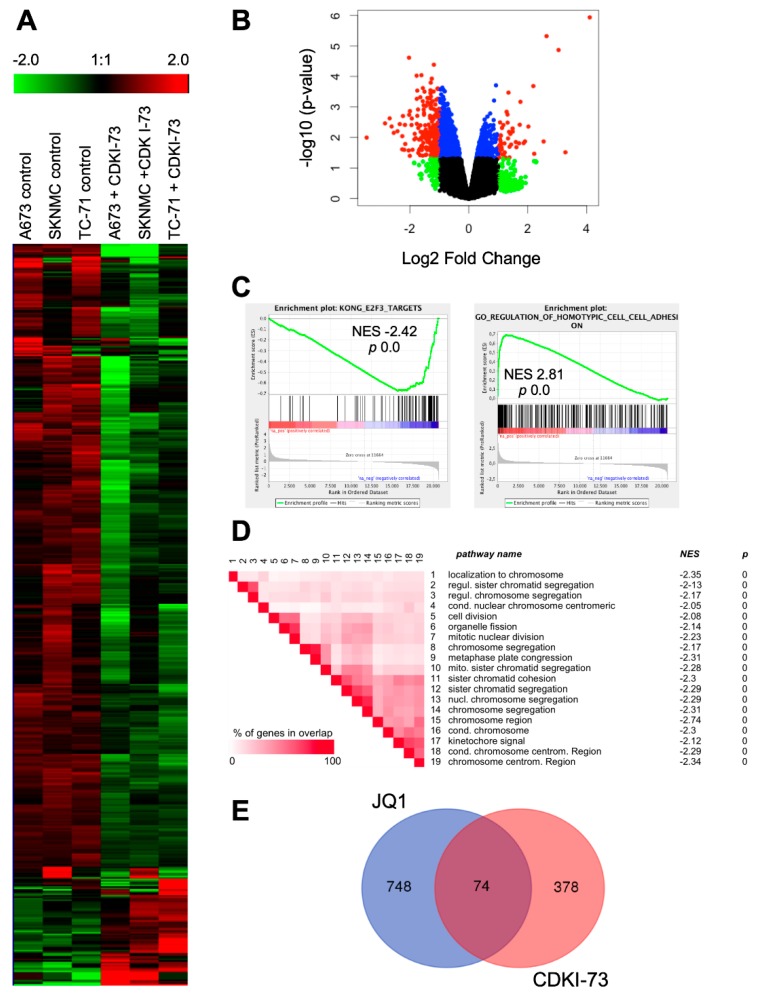
Figure 3.
Expression profile of EwS cells after treatment with CDKI-73. (A) Heat map of 504 genes, 1.5-fold differentially expressed in 3 different EwS lines A673, SKNMC, and TC-71 are shown. Each column represents 1 individual array. Microarray data with their normalized fluorescent signal intensities were used (robust multichip average (RMA), see Materials and Methods; GSE119546). Cells were treated with DMSO or CDKI-73 for 8 h, collected, and then analyzed. (B) Volcano plot for CDKI-73 treated against solvent control EwS cell lines (A673, SKNMC, TC-71), showing the significance p-value (−log 10) plotted over fold change (log 2). The color coding is as follows: red, genes with a p-value <0.05 and an absolute log FC > 1; blue, genes obtaining a p-value <0.05 and an absolute log FC ≤1; green, genes with a p-value ≥0.05 and an absolute log FC >1; and black, genes with a p-value ≥0.05 and an absolute log FC ≤1. (C) Gene set enrichment analysis (GSEA) enrichment plots of down- and up-regulated gene sets after CDKI-73 treatment. NES: normalized enrichment score. GSEA: http://www.broadinstitute.org/gsea/index.jsp (D) GSEA leading-edge analysis of identified gene sets up- or down-regulated after CDKI-73 treatment (C5_all, GO gene sets), respectively. Set-to-set analysis shows a correlation between CDKI-73 treatment and down-regulation of gene sets important for chromosomal regulation. (E) Shared genes differentially expressed after either CDKI-73 or JQ1 treatment in different EwS lines (see [18]; GSE72673), respectively. For Venn diagram, genes ± 1.5-fold differentially expressed were selected for the analysis (http://bioinformatics.psb.ugent.be/webtools/Venn/).

