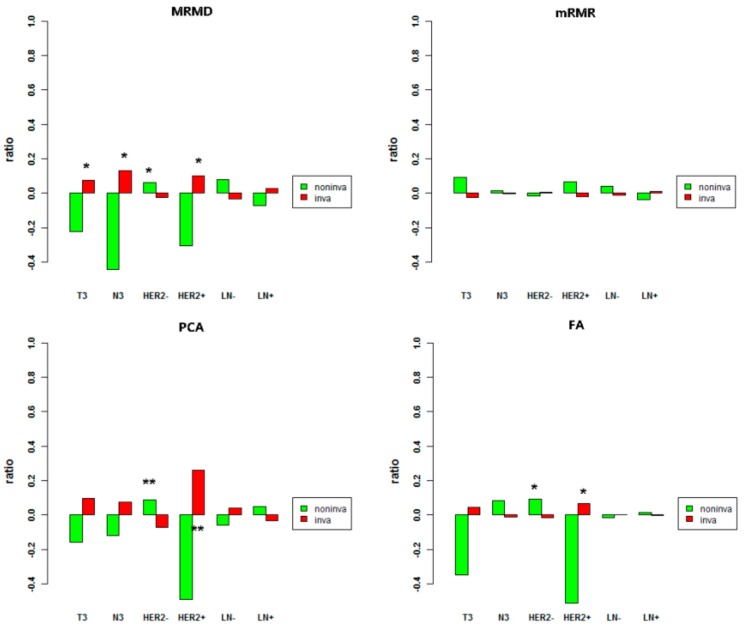
Figure 2.
Four enrichment analyses results of clinical indicators in the two tumor clusters. Red indicates samples predicted by the classifier as invasive, and green indicates samples predicted to be non-invasive. The X axis represents clinical indicators; the Y axis represents the enrichment ratio of Table 0. ** is extremely significant ().

