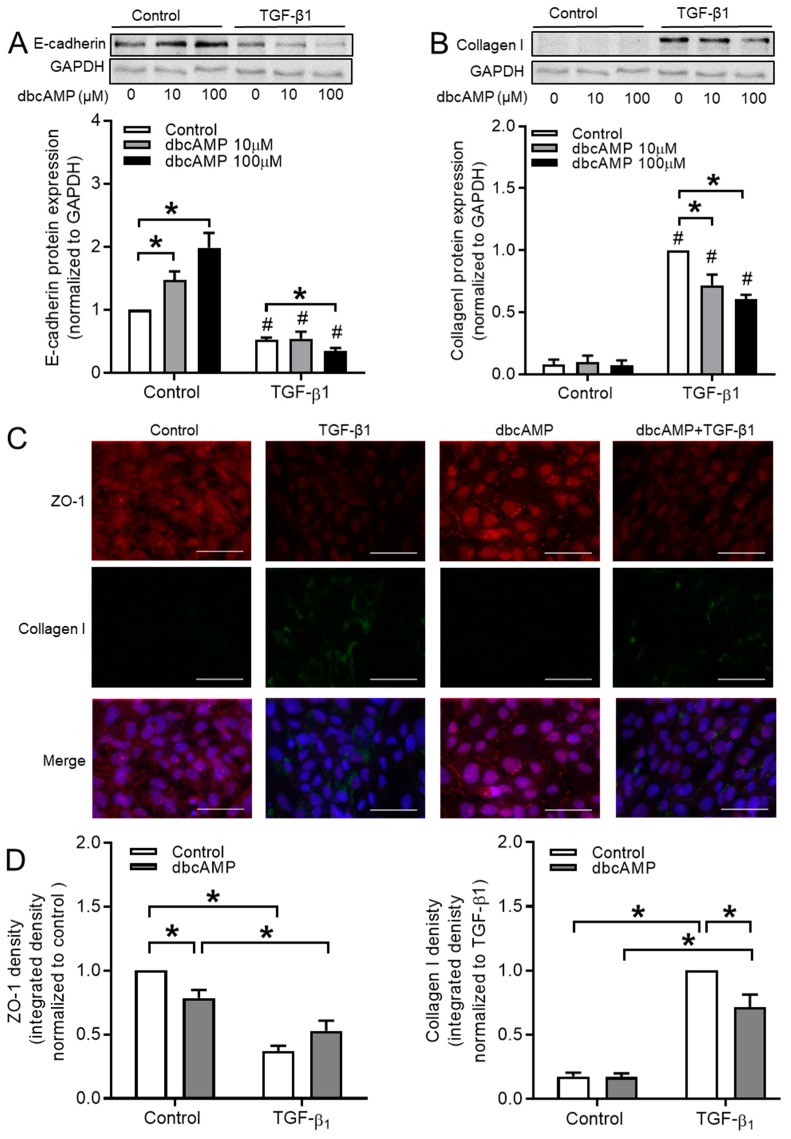
Figure 10.
Effect of dbcAMP on TGF-β1-induced EMT markers expression in BEAS-2B cells. (A,B) protein expressions of E-cadherin (A) and collagen Ӏ (B) were analyzed in BEAS-2B cells pre-incubated with 10 μM or 100 μM dbcAMP for 30 min. before TGF-β1 stimulation. (C,D) Immunofluorescence images (C) and quantification (D) of ZO-1 and collagen Ӏ after TGF-β1 stimulation for 24 h. Scale bar represents 100µm. Data represent 4-6 independent experiments. Data are expressed as mean ± SEM, * p < 0.05; significant difference between indicated groups; # p < 0.05; significant difference between with or without TGF-β1 treatment.

