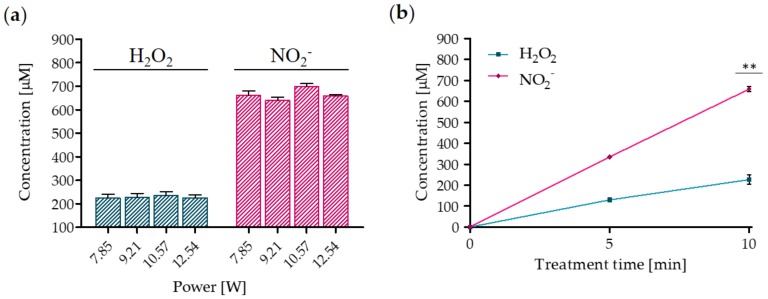
Figure 2.
Plasma treatment leads to the formation of H2O2 and NO2−. (a) Reactive oxygen and nitrogen species (RONS) concentration as a function of the average power after 10 min of plasma treatment. Data are presented as mean ± SEM (n = 3). (b) H2O2 and NO2− concentrations as a function of treatment time. Data are presented as mean ± SEM (n = 3) and statistical significance is specified with asterisks (** p ≤ 0.001 as determined by a paired Student’s t-test, versus the 5 min treatment).

