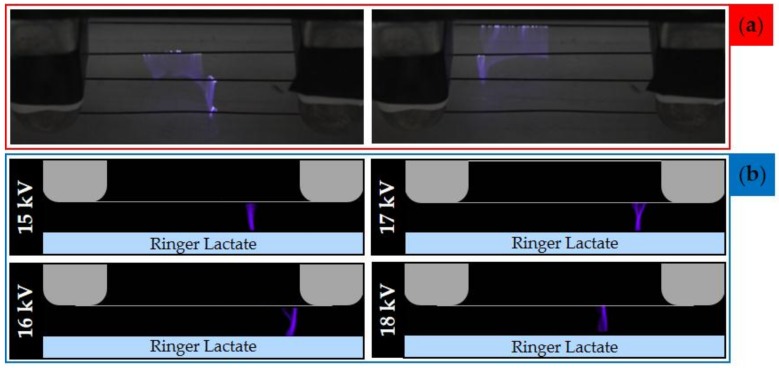
Figure 4.
Low-speed images and high-speed (HS) filter images of the multiwire plasma discharge during RL treatment. (a) Picture of plasma generated during the treatment of PA-RL with an applied voltage of 18 kV and 30 fps. (b) HS filter images of plasma filaments for different values of applied voltage (between 15 to 18 kV) and 100 fps.

