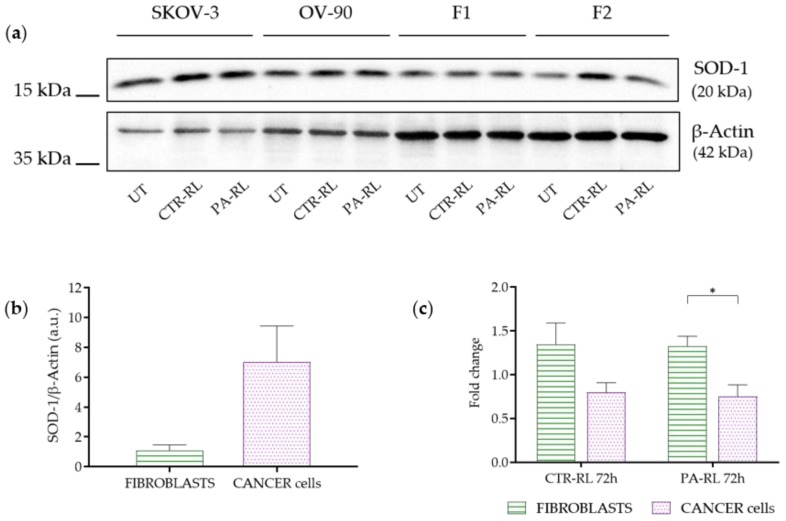
Figure 6.
PA-RL solution induces an increase in Superoxide Dismutase-1 (SOD-1) expression in fibroblasts but not in EOC cell lines. (a) Western blot analysis of EOC cell lines and fibroblasts (F1 and F2) at 72 h after treatment with PA-RL 1:16 (UT, untreated cells). A representative experiment of three is shown. (b) SOD-1 levels in untreated fibroblasts and cancer cell lines. Histograms show densitometric values of the SOD-1 protein normalized to the β-actin used as a loading control. All data are presented as mean ± SEM of three independent experiments. (c) Relative densities of SOD-1 and β-actin were measured using densitometric analysis. SOD-1 levels of CTR-RT and PA-RL 1:16 after 72 h of treatment were normalized to β-actin and plotted as fold change relative to the untreated (UT) sample. All data are presented as mean ± SEM of three independent experiments. Statistical significance is specified with asterisks (* p ≤ 0.05 as determined by a paired Student’s t-test).

