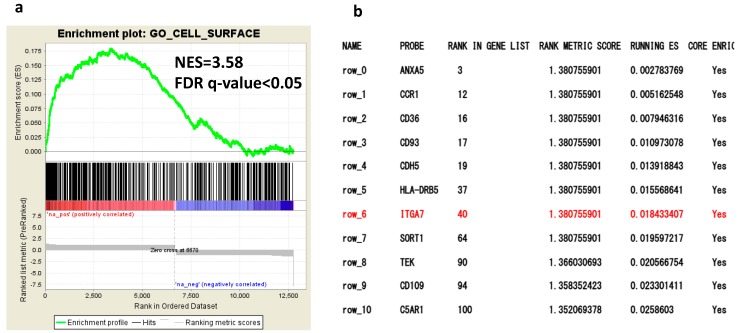
Figure 1.
Gene expression in the acute myelogenous leukemia (AML) with granulocytic sarcoma (GS) group vs. AML without GS group. (a) Gene set enrichment analysis (GSEA) indicates that cell surface gene sets are enriched in AML with GS compared with AML without GS. Normalized enrichment scores (NES) and false discovery rate (FDR) q-values are given for the gene set. (b) List of genes enriched in the cell surface gene set derived from Gene Ontology annotations in GSEA (http://software.broadinstitute.org/gsea/msigdb/collection_details.jsp#C5) (Collection 5). The order of genes is ranked according to the running enrichment score.

