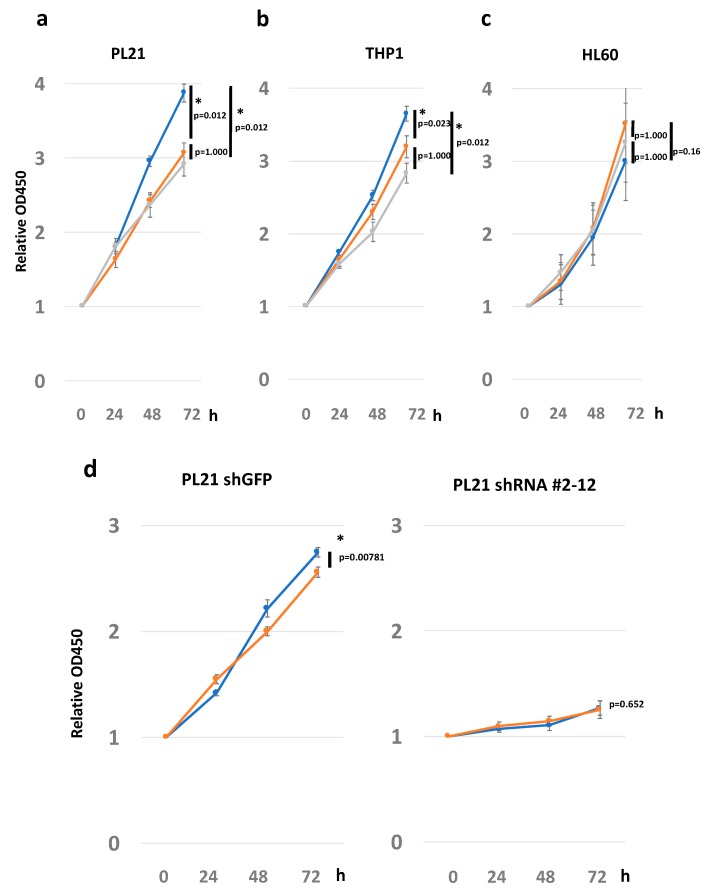
Figure 4.
Cell proliferation assay with stimulation of laminin 211 and 411. Proliferation of (a) PL21, (b) THP1, and (c) HL60 cells in the presence of laminin 211, laminin 411, and the control groups. The vertical axis shows the proliferation rate starting at 0 h. The horizontal axis shows various time points. The experiments were replicated three times. The lines indicate proliferation on dishes coated with laminin 211 (blue), laminin 411 (orange), or the uncoated control (gray). (d) Proliferation of PL21 with shGFP (control) and shITGA7 (#2-12). Lines represent proliferation on dishes coated with laminin 211 (blue) or laminin 411 (orange). Proliferation rates for each of the conditions were analyzed by the Friedman test or Wilcoxon’s rank sum test. The error bars show the standard error of the mean. * p < 0.05 was considered statistically significant.

