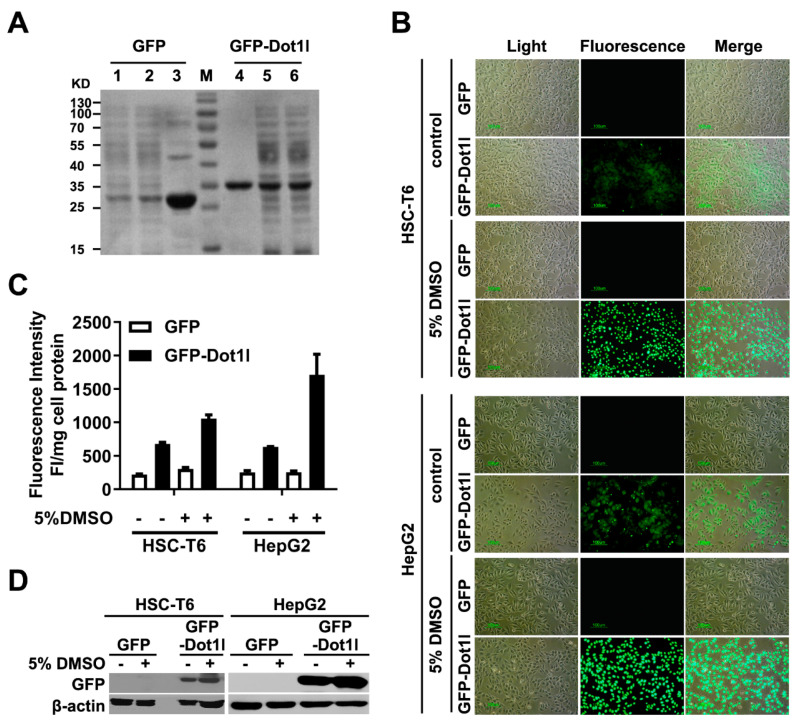
Figure 7.
(A) Coomassie Brilliant Blue-stained SDS-PAGE of GFP-Dot1l fusion protein produced by recombinant prokaryotic expression system. Lanes 1 and 6 indicate no isopropyl-β-D-thiogalactopyranoside (IPTG) induction, lanes 2 and 5 indicate IPTG induction, lanes 3 and 4 indicate purified protein. (B) Fluorescence microscopy of purified GFP and GFP-Dot1l protein delivery in HSC-T6 and HepG2 cells with or without DMSO pretreatment. (C) Fluorescence intensity quantification of purified GFP and GFP-Dot1l protein in the cytosol. The statistical analysis is shown in Supplementary Figure S1F (top panel indicates HSC-T6, bottom panel indicates HepG2). (D) GFP and GFP-Dot1l protein in the cytosol of HSC-T6 and HepG2 cells examined by Western blotting; anti-GFP antibody was used to detect the protein. Cell lysate fluorescence intensity was adjusted by protein concentration examined by bicinchoninic acid (BCA) assays.

