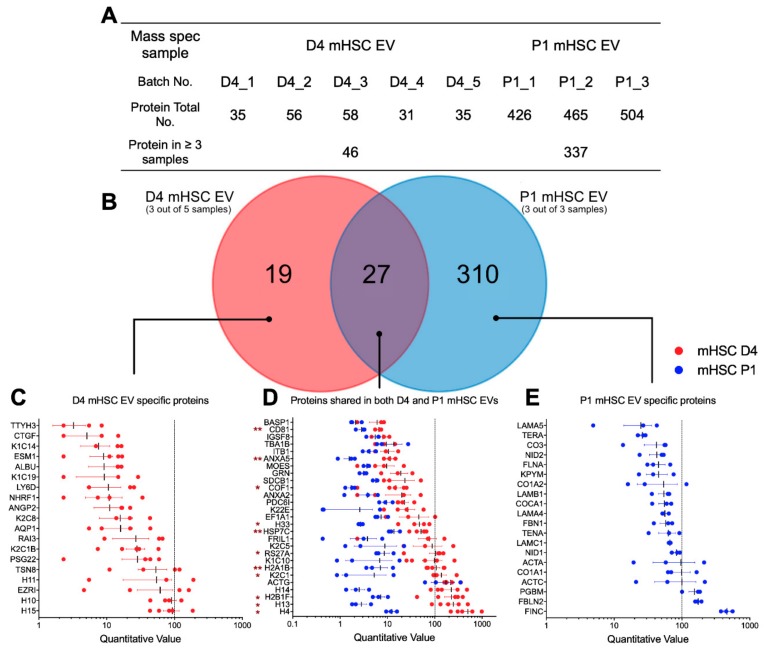
Figure 3.
Proteomic composition of mHSC EVs. (A) Summary of quantitative features of EV proteins analyzed from five D4 mHSC EV samples or three P1 mHSC EV samples. (B) Venn diagram showing distribution of proteins between EVs from D4 versus P1 mHSC. The figure also shows the identities and quantifications of (C) the 19 proteins specific for D4 mHSC EVs; (D) the 27 proteins shared by both groups for which 11 proteins were significantly enriched in EVs from D4 mHSC (*, p < 0.05, **, p < 0.01) and (E) the 20 most abundant proteins specific for EVs from P1 mHSC.

