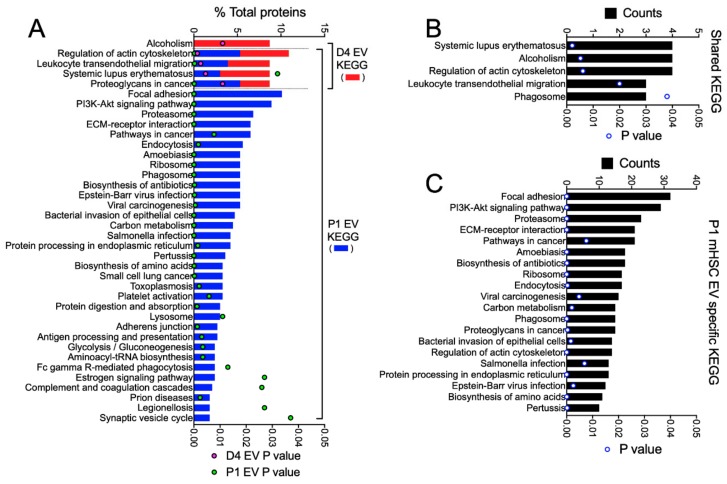
Figure 6.
KEGG pathway analysis of proteins in EVs from D4 and/or P1 mHSC. EV proteins were analyzed online using DAVID v6.8 software for KEGG pathway analysis. The figure shows pathways that were (A) in the entire mHSC EV proteome from D4 mHSC versus P1 mHSC; (B) shared between EVs from D4 and P1 mHSC; or (C) specific to P1 mHSC EVs (top 20 pathways shown). Only pathways with significant enrichment (p < 0.05) are shown.

