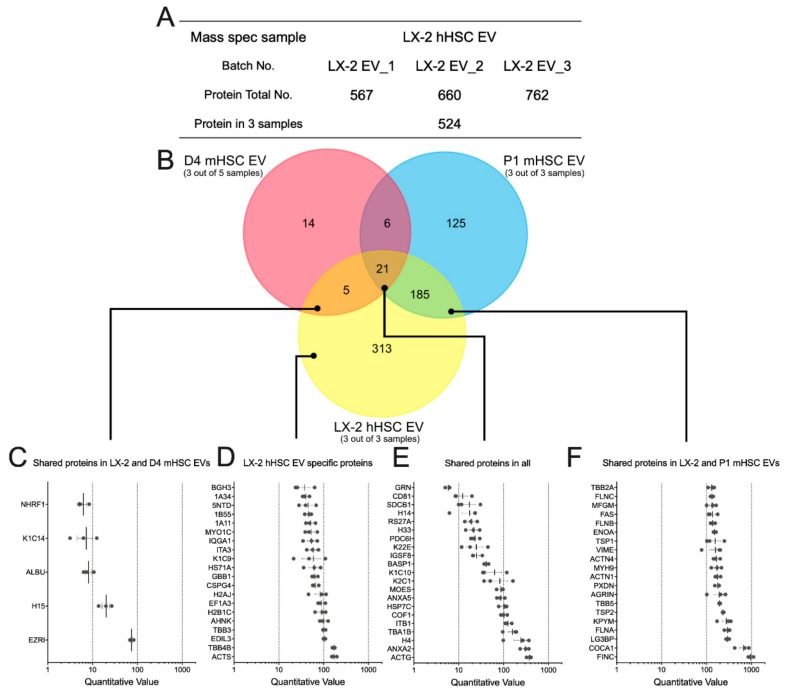
Figure 7.
Proteomic composition of EVs from LX-2 hHSC and/or D4 or P1 mHSC. (A) Summary of quantitative features of EV proteins analyzed from LX-2 hHSC EV samples. (B) Venn diagram showing distribution of proteins between EVs from LX-2 hHSC, D4 mHSC and P1 mHSC. Also shown are the identities and quantifications of (C) the five proteins shared between LX-2 hHSC EVs and D4 mHSC EVs; (D) the 20 most abundant proteins specific to EVs from LX-2 hHSC; (E) the 21 proteins shared by EVs from all three cell types; and (F) the 20 most abundant proteins shared by EVs from LX-2 hHSC and P1 mHSC.

