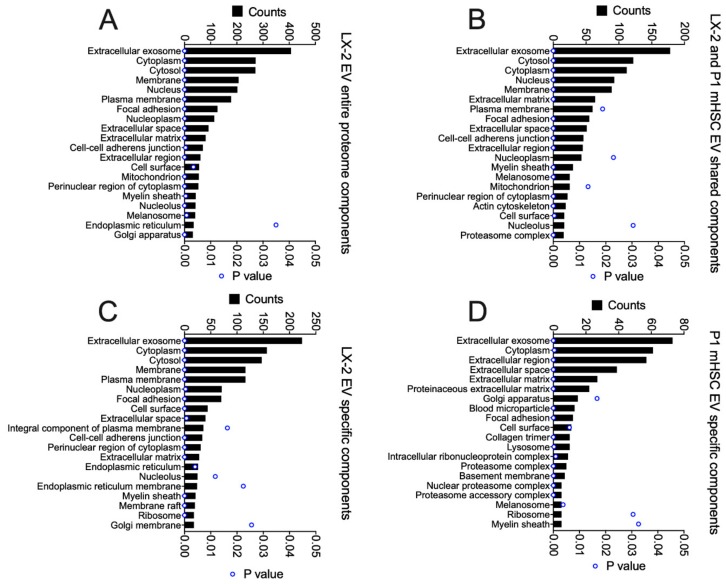
Figure 8.
Cellular component analysis of proteins in EVs from LX-2 hHSC and/or P1 mHSC. GO analysis was performed on proteins in EVs from LX-2 hHSC as in Figure 5. The figure shows the 20 most highly ranked cellular components for proteins that were (A) in the entire LX-2 HSC EV proteome; (B) shared between EVs from LX-2 hHSC and P1 mHSC; (C) specific to LX-2 hHSC EVs; or (D) specific to P1 mHSC EVs. Only cellular components with significant enrichment (p < 0.05) are shown.

