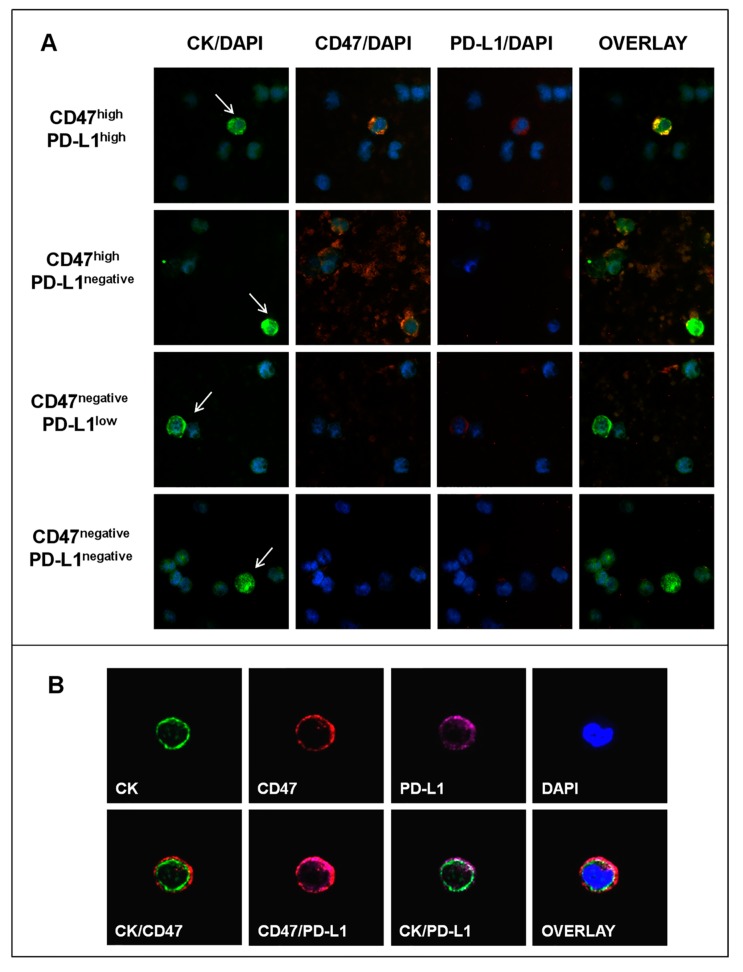
Figure 2.
CD47 and PD-L1 expression on CTCs of BC patients. (A) Representative images of phenotypically-distinct CTC subsets according to CD47 and/or PD-L1 co-expression, Ariol microscopy (400X). Arrows indicate CTCs (CK+ cells) among peripheral blood mononuclear cells (PBMCs) (CK- cells). (B) A CTC (CK+ cell) positive for CD47 and PD-L1 expression, Confocal Laser Scanning Microscopy (CLSM) (600×). Distinct localization of the three molecules at the single CTC level.

